
Need to estimate uncertainty? Then, you will need a calculator to create uncertainty budgets. In this guide, you a see an uncertainty budget example from our Simple Uncertainty Calculator.
This guide will cover all of the elements that are part of an uncertainty budget and why you need them. Plus, you will see plenty of examples that should help you know what your auditors are expecting to see from you so you can deliver an uncertainty analysis that meets their expectations.
What are Uncertainty Budgets?
The Best Tool For Performing Uncertainty Analysis
An uncertainty budget is an itemized table of components that contribute to the uncertainty in measurement results. It reveals important information that identifies, quantifies, and characterizes each source of uncertainty.
With respect to measurement quality, it is an essential tool typically utilized by physicists, engineers, and metrologists to perform uncertainty analysis. The goal of an uncertainty budget is to effectively calculate measurement uncertainty using a well-organized, structured approach (typically following the GUM method). The benefit is it provides the laboratory with a formal record of the uncertainty analysis process which can be shared with other professionals who can validate the results.
Benefits of Uncertainty Budgets
How Uncertainty Budgets Improve Measurement Quality.
There are several ways uncertainty budgets can help improve measurement quality. Here is a list of common benefits associated with these budgets:
- Meet ISO 17025 requirements.
- Obtain or maintain ISO 17025 accreditation.
- Estimate the CMC uncertainty expressed in Scope of Accreditation.
- Reduce time and effort calculating measurement uncertainty of calibration or test results.
- Provide objective evidence that an uncertainty analysis was performed.
- Improve quality through evaluation of uncertainty contributors (i.e. find greatest contributors and identify where reductions can be made).
- Increase confidence in decision making.
- Prevent or reduce the occurrence of errors in measurement results.
- Reduce measurement risk (e.g. Statements of Conformity and Decision Rules).
- Increase customer satisfaction and improve customer service.
Uncertainty Budget Example
In this guide, you will see an uncertainty budget example and breakdown from our Simple Uncertainty Calculator. It is the calculator that we use most to create uncertainty budgets. Therefore, it is the best option to show you an example.
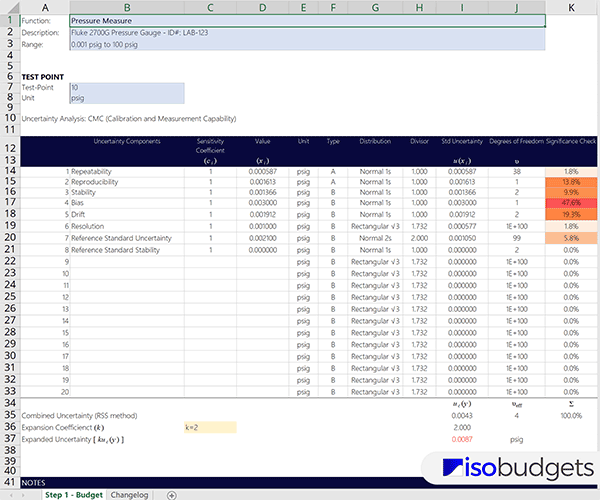
In the image below, you will see an example uncertainty budget from the Simple Uncertainty Calculator version 5. This is what our uncertainty budgets look like in 2022.
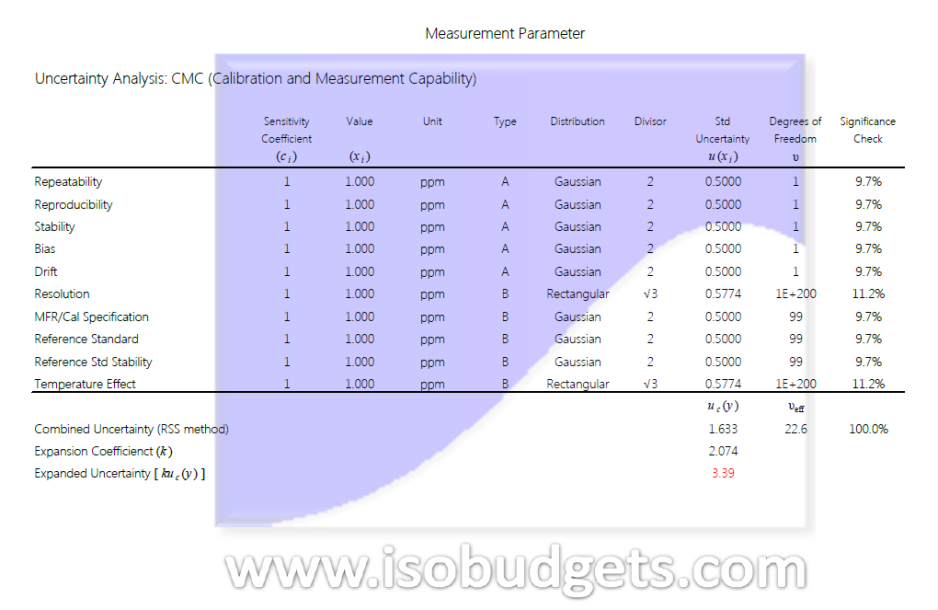
In this image, you will see our old uncertainty budget example from 2012. You can see the difference in uncertainty budgets from then to now. Hence, the reason we updated this guide.
Elements of an Uncertainty Budget
In this section, you will learn more about the elements that make up an uncertainty budget and why they are important. There is a lot of information that goes into an uncertainty analysis and it is good to make sure your budgets include everything that you need.
Scroll through the sections below to learn more about each part of the uncertainty budget and see an example.
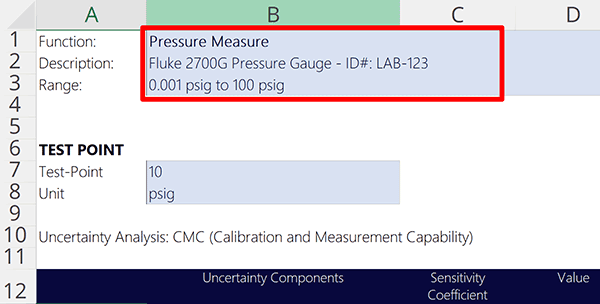
Description of the Measurement Function
Every uncertainty budget should begin with a section that describes the measurement function and parameter. It is important for organizing your uncertainty budgets by specific laboratories activities.
Typically, this section should include:
- A name or title of the measurement function,
- The equipment or method used to perform the test or measurement; and
- The measurement range(s) covered by the uncertainty budget.
Look at the image below to see this in example uncertainty budget.
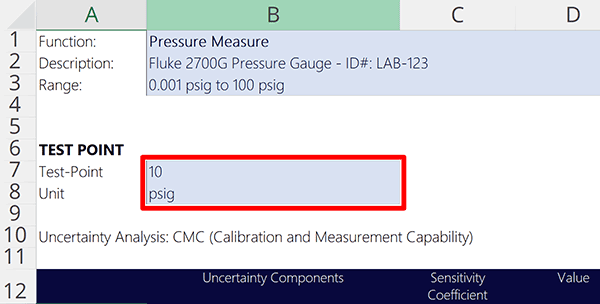
Evaluated Test-Point and Unit of Measurement
An uncertainty budget should also include information on the test-point and unit of measurement evaluated as part of the uncertainty analysis.
Look at the image below to see test-point and unit of measurement in the uncertainty budget example.
Sources of Uncertainty
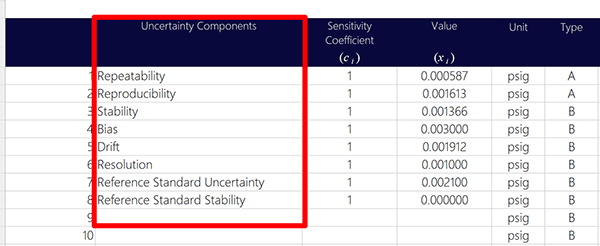
Most importantly, uncertainty budgets should include the sources of uncertainty that contribute to uncertainty in measurement.
In the image below, you will see a list of factors that contribute to measurement uncertainty.
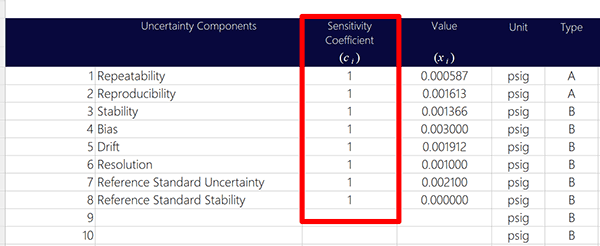
Sensitivity Coefficiencts
Sensitivity coefficients are an optional element of an uncertainty budget template. However, they are very essential if you are trained for the evaluation of measurement uncertainty. They help you:
- convert uncertainties to similar units of measurement, and
- adjust uncertainties to equivalent levels of magnitude.
Look at the image below to sensitivity coefficients in an uncertainty budget.
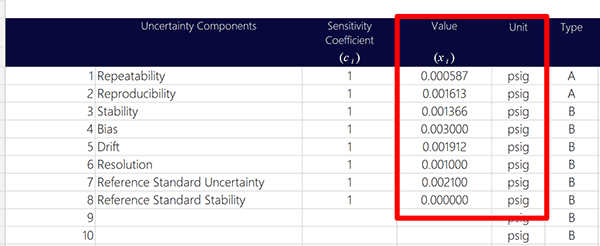
Quantified Value of Uncertainty
Once sources of uncertainty are identified, you will need to quantify them and include them in your uncertainty budget with their associated unit of measurement.
Look at the image below to see an example.
Types of Uncertainty (A or B)
After quantifying sources of uncertainty, you will need to characterize each one by:
- uncertainty type, and
- probability distribution.
The first step to characterizing uncertainty contributors is selecting the uncertainty type, such as:
Look at the image below to see an example of uncertainty types in an uncertainty budget.
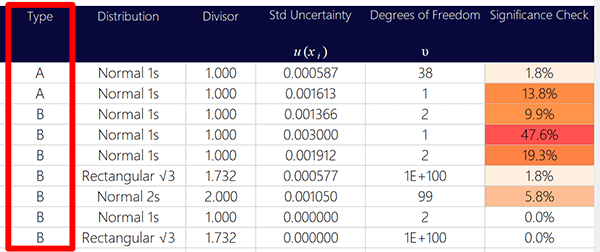
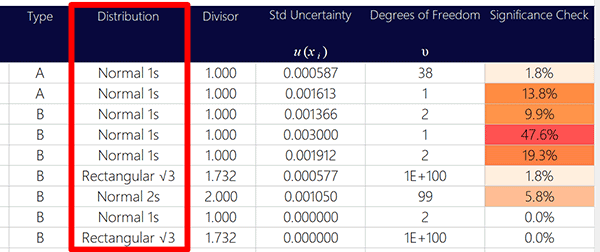
Probability Distribution
The second step to characterizing uncertainty contributors is selecting the probability distribution. There are many different types of probability distribution, but some of the most commonly used distributions are:
- Normal distribution,
- Rectangular distribution,
- Triangular distribution,
- U-shaped distribution, and
- Rayleigh distribution,
Typically, most people only use normal and rectangular distributions. Look at the image below to see probability distributions in an uncertainty budget.
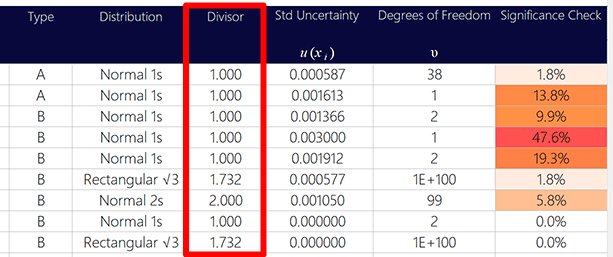
Divisor
Divisors are important. They help you convert uncertainty contributors to standard uncertainties (i.e. standard deviation equivalents). Divisors are determined by the probability distribution that you select.
In the image below, you will see divisors listed in an uncertainty budget calculator.
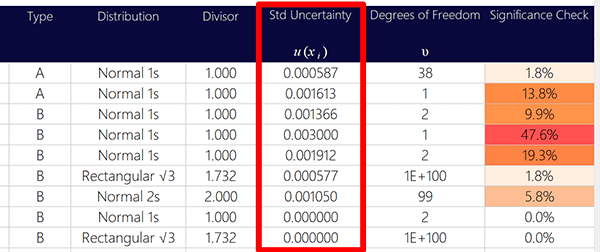
Standard Uncertainty
Standard uncertainty is your uncertainty contributor converted to a standard deviation equivalent with a 68% confidence level. When all of your sources of uncertainty are on the same level, they are ready for the Root Sum of Squares (RSS) process recommended in the Guide to the Expression of Uncertainty in Measurement (GUM) to calculate the combined uncertainty.
Look at the image below to see an example of standard uncertainty in an uncertainty budget.
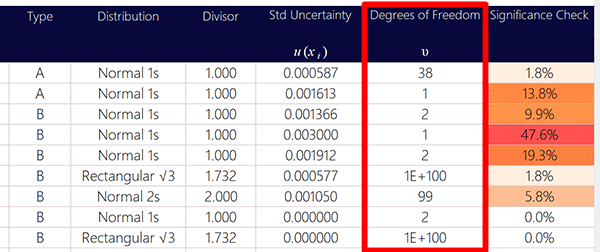
Degrees of Freedom
Degrees of freedom can be an important element of your uncertainty analysis if you determine your coverage factor using the Student’s T Table. Otherwise, you probably do not care about it if you only use a coverage factor of k=2. Nonetheless, you can still use degrees of freedom to evaluate the quality of your uncertainty contributor data and uncertainty analysis.
Look at the image below to see degrees of freedom in an uncertainty budget.
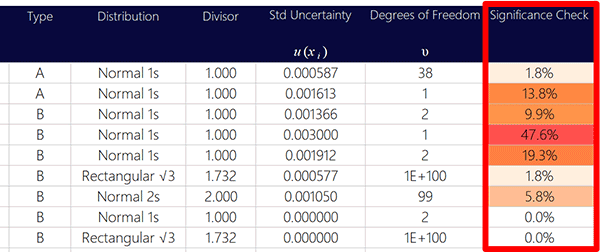
Significance Check
Knowing which sources of uncertainty contribute the most to your expanded uncertainty is important. Especially if you plan to improve your estimated measurement uncertainty. It informs you about which uncertainty contributors are significant and which are not. This is great information for improving your measurement results and avoid wasting time on optimizing the wrong contributors.
In the image below, you will see the significance check listed in an uncertainty budget calculator.
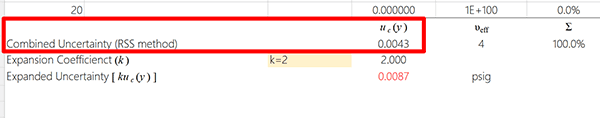
Combined Uncertainty
The combined standard uncertainty is the result of combining all your sources of uncertainty using the Root Sum of Squares method from the JCGM 100:2008 (i.e. GUM).
Look at the image below to see how the combined uncertainty is expressed in the uncertainty budget.
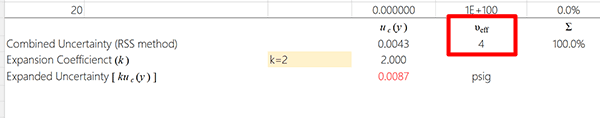
Effective Degrees of Freedom
The effective degrees of freedom is an approximate, weighted average of the degrees of freedom associated with your sources of uncertainty. It is calculated using the Welch Satterthwaite approximation equation.
If you use the Student’s T Table to find your expansion coefficient, then this value will be important to you. If you only use a coverage factor of k=2, then knowing the effective degrees of freedom is optional.
Look at the image below to see the effective degrees of freedom in an uncertainty budget.
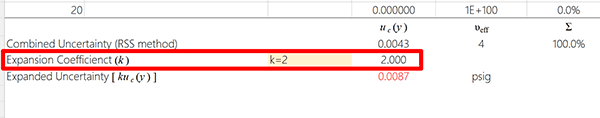
Expansion Coefficient
The expansion coefficient, or coverage factor, is a multiplier used to expand the combined uncertainty to the desired level of confidence, such as 95%. The expansion coefficient is based on the confidence level selected and the degrees of freedom.
Most people select 95% confidence where k=2 assuming an infinite degrees of freedom. Others will use the Student’s T table to find the value of k.
Look at the image below to the expansion coefficient.
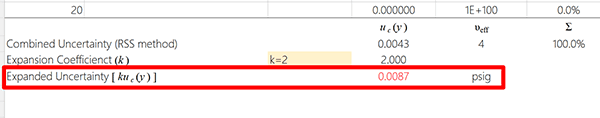
Expanded Uncertainty
The expanded uncertainty is the result of multiplying the combined uncertainty by the desired expansion coefficient. It is the final result of your uncertainty analysis that you will use to describe the uncertainty of your measurement results (i.e. measurement result ± expanded uncertainty).
In the image below, you will see the expanded uncertainty in the uncertainty budget example.
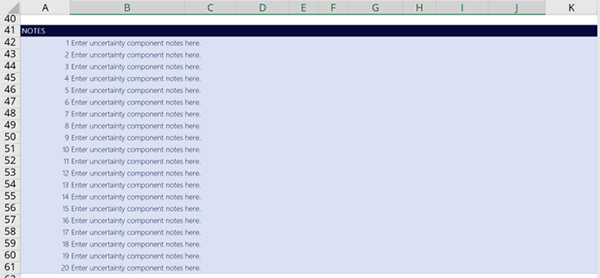
Uncertainty Notes and References
Every uncertainty budget needs to have notes. You should use this section to give more details about your uncertainty components, such as:
- Where they came from,
- How they were calculated, and
- Why they are significant or not.
Without notes, your uncertainty budget is missing important information that should be communicated to yourself, coworkers, and assessors.
Look at the image below to see the notes section of an uncertainty budget.
Who Does Uncertainty Budgets?
Who Makes These Reports?
Most laboratories have personnel, such a Metrologist, physicist, or engineer, as members of their technical or quality staff that routinely evaluate their measurement processes for uncertainty.
Typically, these personnel are the ones performing the uncertainty analysis and creating uncertainty budgets. Some laboratories are unable to hire and maintain these high-salary personnel. Therefore, they either subcontract their uncertainty analysis to a specialist or send their personnel to training courses and perform the task in-house.
There are always pros and cons to either approach. Whichever method you choose it is always a good idea to get external validation and consultation prior to assessments. Furthermore, always review your accreditation body policies, requirements, and guides. Finally, make sure to compare your results with other laboratories’ scope of accreditation.
If your organization has any questions or would like a professional to manage their uncertainty budgets, please contact ISOBudgets LLC at [email protected]. Our uncertainty budgets are professional, high-quality reports that meet ISO 17025 requirements. We make sure the uncertainty budgets we provide meet your accreditation body’s policies and requirements.
—
Originally published: 10/29/2012
Updated on: 05/24/2022


6 Comments