Key Takeaways
- Type A Evaluation: Methods based on the statistical analysis of a series of observations (Repeatability, Reproducibility).
- Type B Evaluation: Methods based on means other than statistical analysis (Calibration reports, specs, history).
- Purpose: The distinction is based on the *method of evaluation*, not the nature of the uncertainty itself.
- Consistency: Both types are expressed as variances and combined using the same mathematical rules.
- Common Error: Categorizing by “Random” or “Systematic” instead of the evaluation method used.
Introduction
Type A and Type B uncertainty are two elements that are commonly discussed in estimating measurement uncertainty.
Uncertainty type is covered in most measurement uncertainty guides and uncertainty training courses. Auditors review uncertainty budgets to make sure the components are categorized correctly.
However, have you ever looked at most of the information published on Type A and Type B uncertainty?
It’s very minimal. No one covers the topic of uncertainty type as well as the GUM. There is so much information left out of other guides and training.
It might be the reason why most people only evaluate type B uncertainty with a rectangular distribution when there are so many more realistic options.
Why are other options omitted?
In this guide, I am going to teach you all about Type A and Type B uncertainty as explained in the GUM. However, I am going explain in a manner that doesn’t require you to have a PhD.
So, if you want learn how to calculate uncertainty, make sure to read this guide to learn everything you need to know about Type A and Type B uncertainty.
Background
Before you learn about uncertainty type classifications, it’s a good idea to know more about why they exist and where they came from.
In 1980, the CIPM Recommendation INC-1 suggested that measurement uncertainty components should be grouped into two categories; Type A and Type B.
Below is an exert from the Vocabulary in Metrology;
“In the CIPM Recommendation INC-1 (1980) on the Statement of Uncertainties, it is suggested that the components of measurement uncertainty should be grouped into two categories, Type A and Type B, according to whether they were evaluated by statistical methods or otherwise, and that they be combined to yield a variance according to the rules of mathematical probability theory by also treating the Type B components in terms of variances. The resulting standard deviation is an expression of a measurement uncertainty. A view of the Uncertainty Approach was detailed in the Guide to the expression of uncertainty in measurement (GUM) (1993, corrected and reprinted in 1995) that focused on the mathematical treatment of measurement uncertainty through an explicit measurement model under the assumption that the measurand can be characterized by an essentially unique value. Moreover, in the GUM as well as in IEC documents, guidance is provided on the Uncertainty Approach in the case of a single reading of a calibrated instrument, a situation normally met in industrial metrology.” – VIM 2012
As you can see, the VIM gives a great explanation and recommends that you read the GUM for more details.
Here is an exert from the Guide to the Expression of Uncertainty in Measurement;
“3.3.4 The purpose of the Type A and Type B classification is to indicate the two different ways of evaluating uncertainty components and is for convenience of discussion only; the classification is not meant to indicate that there is any difference in the nature of the components resulting from the two types of evaluation. Both types of evaluation are based on probability distributions (C.2.3), and the uncertainty components resulting from either type are quantified by variances or standard deviations.” – JCGM 100
For more information on the CIPM recommendation INC-1 (1980), go to iso.org. The text is in French but can be easily translated with tools like Google Translate.
Now that you have read the VIM and the GUM, you can understand that the use of uncertainty types (i.e. A & B) are to help you quickly determine how the data was evaluated.
If you continue to read the GUM, it will teach the difference between Type A and Type B uncertainty. See the excerpt below.
“3.3.5 The estimated variance u2 characterizing an uncertainty component obtained from a Type A evaluation is calculated from series of repeated observations and is the familiar statistically estimated variance s2 (see 4.2). The estimated standard deviation (C.2.12, C.2.21, C.3.3) u, the positive square root of u2, is thus u = s and for convenience is sometimes called a Type A standard uncertainty. For an uncertainty component obtained from a Type B evaluation, the estimated variance u2 is evaluated using available knowledge (see 4.3), and the estimated standard deviation u is sometimes called a Type B standard uncertainty.” – JCGM 100
From the excerpt above, you can determine two things;
• Type A uncertainty is calculated from a series of observations,
• Type B uncertainty is evaluated using available information.
Furthermore, the GUM provides you with information about the probability distributions for each uncertainty type.
“Thus a Type A standard uncertainty is obtained from a probability density function (C.2.5) derived from an observed frequency distribution (C.2.18), while a Type B standard uncertainty is obtained from an assumed probability density function based on the degree of belief that an event will occur [often called subjective probability (C.2.1)]. Both approaches employ recognized interpretations of probability.” – JCGM 100
Type A uncertainty is characterized by the observed frequency distribution which means that you should look at the histogram to find the correct probability distribution.
Following the Central Limit Theorem, the more samples that you collect, the more the data will begin to resemble a normal distribution. Here is a link to an amazing video on the Central Limit Theorem. I recommend that you watch it.
On the other hand, Type B uncertainty is characterized using an assumed probability distribution based on available information. Without the original data or a histogram, you are left to determine how the data is characterized based on your information sources.
Most of the time, you are not given much information. Therefore, people typically assume a rectangular distribution.
However, there are plenty of other ways for you to evaluate Type B uncertainty data that no one ever references; not even in the best guides to estimating uncertainty.
Today, I am going to cover everything that you need to know about Type A and Type B uncertainty. Look at the list below to see what is covered in this guide.
1. What is Type A Uncertainty
2. Evaluation of Type A Uncertainty
3. Examples of Evaluating Type A Uncertainty
4. What is Type B Uncertainty
5. Evaluation of Type B Uncertainty
6. Examples of Evaluating Type B Uncertainty
7. Difference Between Type A and Type B Uncertainty
8. How to Choose Type A or Type B

See How We Can Help Your Lab Get ISO/IEC 17025:2017 Accredited
- Uncertainty Budgets – let us estimate uncertainty for you.
- Custom QMS – we’ll create your quality manual, procedures, lists, and forms.
- Training – get online training that teaches you how to estimate uncertainty.
What is Type A Uncertainty
According to the Vocabulary in Metrology (VIM), Type A Uncertainty is the “evaluation of a component of measurement uncertainty by a statistical analysis of measured quantity values obtained under defined measurement conditions.”
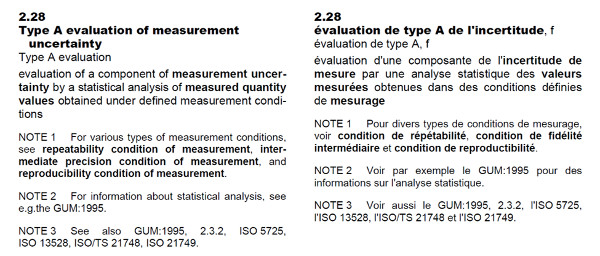
In the Guide to the Expression of Uncertainty in Measurement (GUM), Type A evaluation of uncertainty is defined as the method of evaluation of uncertainty by the statistical analysis of series of observations.
Essentially, Type A Uncertainty is data collected from a series of observations and evaluated using statistical methods associated with the analysis of variance (ANOVA).
So, if you collect repeated samples of similar measurement results and evaluate it by calculating the mean, standard deviation, and degrees of freedom, your uncertainty component would be classified as Type A uncertainty.
Evaluation of Type A Uncertainty
For most cases, the best way to evaluate Type A uncertainty data is by calculating the;
• Arithmetic Mean,
• Standard Deviation, and
• Degrees of Freedom
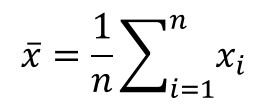
Arithmetic Mean
When performing a series of repeated measurements, you will want to know the average value of your sample set.
This is where the arithmetic mean equation can help you evaluate Type A uncertainty. You can use the value later to predict the expected value of future measurement results.
Definition
The central number of set of numbers that is calculated by adding quantities together and then dividing the total number of quantities.
Equation
How to Calculate
1. Add all the values together.
2. Count the number of values.
3. Divide step 1 by step 2.
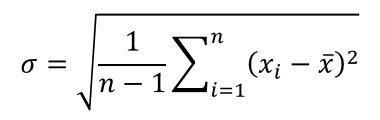
Standard Deviation
When performing a series of repeated measurements, you will also want to know the average variance of your sample set.
Here, you will want to calculate the standard deviation. It is most common Type A evaluation used in uncertainty analysis.
So, if there were only one function to learn, this would be the one to focus your attention on.
Definition
A measure of the dispersion of a set of data from its mean (i.e. average).
Equation
How to Calculate
1. Subtract each value from the mean.
2. Square each value in step 1.
3. Add all of the values from step 2.
4. Count the number of values and Subtract it by 1.
5. Divide step 3 by step 4.
6. Calculate the Square Root of step 5.
Degrees of Freedom
After calculating the mean and standard deviation, you need to determine the degrees of freedom associated with your sample set.
It is an important value that most people neglect to calculate. Even most guides on measurement uncertainty forget to include it in their text. However, the GUM does not forget to mention it.
In fact, in section 4.2.6, the GUM recommends that you should always include the degrees of freedom when documenting Type A uncertainty evaluations.
I agree.
I always include the degrees of freedom when evaluating Type A data and in my uncertainty budgets.
You can also use it to estimate confidence intervals and coverage factors.
Definition
The number of values in the final calculation of a statistic that are free to vary.
Equation
How to Calculate
1. Count the number of values in the sample set.
2. Subtract the value in step 1 by 1.
Example of Evaluating Type A Uncertainty
To give you an example of evaluating Type A uncertainty data, I am going to show you two common scenarios people encounter when estimating measurement uncertainty.
• Single Repeatability Test, and
• Multiple Repeatability Tests
Single Repeatability Test
Imagine you are estimating uncertainty in measurement and need to obtain some Type A data. So, you perform a repeatability test and collect a series of repeated measurements.
Now that you have collected data, you need to evaluate it. Therefore, you calculate the mean, standard deviation, and the degrees of freedom.
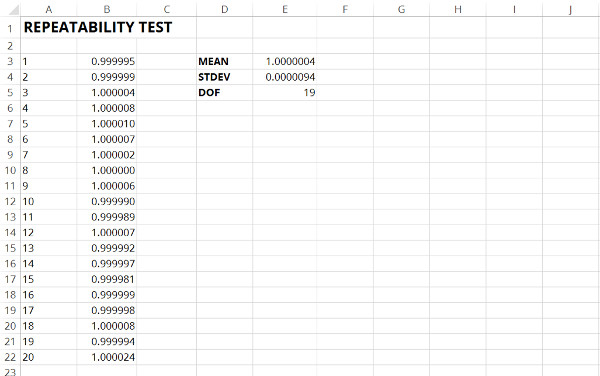
Next, you add the standard deviation and degrees of freedom to your uncertainty budget for repeatability.
Multiple Repeatability Tests
In this scenario, let’s imagine you are estimating measurement uncertainty for a measurement system that is critical to your laboratory. Try to think of a reference standard that you own.
It is so important that you perform a repeatability test for this system every month and document the results.
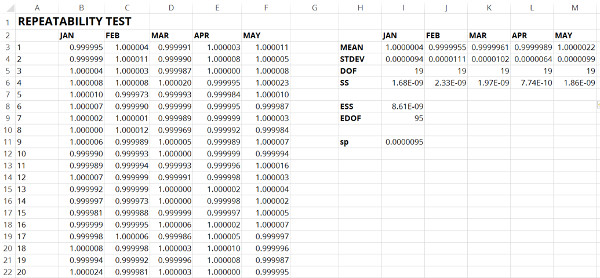
Your records have the mean, standard deviation, and degrees of freedom listed for each month.
With so much Type A data, you are probably wondering, “Which results do I include in my uncertainty budget?”
The answer is all of them; or, at least, the last twelve months.
To evaluate your Type A uncertainty data, you will want to use the method of pooled variance. It is the best way to combine or pool your standard deviations.
After performing this analysis, you will want to the pooled standard deviation to your uncertainty budget for repeatability.
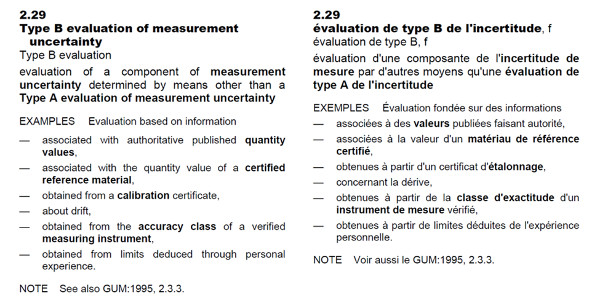
What is Type B Uncertainty
According to the Vocabulary in Metrology (VIM), Type B Uncertainty is the “evaluation of a component of measurement uncertainty determined by means other than a Type A evaluation of measurement uncertainty.”
In the Guide to the Expression of Uncertainty in Measurement (GUM), Type B evaluation of uncertainty is defined as the method of evaluation of uncertainty by means other than the statistical analysis of series of observations.
Essentially, Type B Uncertainty is data collected from anything other than an experiment performed by you.
Even if you can analyze the data statistically, it is not Type A data if you did not collect it from a series of observations.
Most of the Type B data that you will use to estimate uncertainty will come from;
• Calibration reports,
• Proficiency testing reports,
• Manufacturer’s manuals,
• Datasheets,
• Standard methods,
• Calibration procedures,
• Journal articles,
• Conference papers,
• White papers,
• Industry guides,
• Textbooks, and
• Other available information.
Evaluation of Type B Uncertainty
Since Type B Uncertainty can come from so many different sources, there are a lot ways that it can be evaluated.
This means that there is a lot of information to cover in this section.
Most of the time, people default to assigning a rectangular distribution to an uncertainty component and using a square root of three divisor to convert quantities to standard uncertainty.
If this describes how you evaluate uncertainty in measurement, go ahead and raise your hand.
The good news is that this will work for 90% of the uncertainty calculations that you will perform in your lifetime. However, there are many more realistic options available for you to use to evaluate Type B uncertainty.
It depends whether or not you want use them or not.
If you are interested, keep reading. I am going to cover the evaluation methods in the GUM that most measurement uncertainty guides tend to leave out.
“It should be recognized that a Type B evaluation of standard uncertainty can be as reliable as a Type A evaluation”
Manufacture Specifications & Calibration Reports
In section 4.3.3 of the GUM, the guide gives recommendations for evaluating information published in manufacturer’s specifications and calibration reports.
“4.3.3 If the estimate xi is taken from a manufacturer’s specification, calibration certificate, handbook, or other source and its quoted uncertainty is stated to be a particular multiple of a standard deviation, the standard uncertainty u(xi) is simply the quoted value divided by the multiplier, and the estimated variance u2(xi) is the square of that quotient.”
Additionally, in section 4.3.4 of the GUM, the guide gives you more information for evaluating manufacture specifications.
“4.3.4 The quoted uncertainty of xi is not necessarily given as a multiple of a standard deviation as in 4.3.3. Instead, one may find it stated that the quoted uncertainty defines an interval having a 90, 95, or 99 percent level of confidence (see 6.2.2). Unless otherwise indicated, one may assume that a normal distribution (C.2.14) was used to calculate the quoted uncertainty, and recover the standard uncertainty of xi by dividing the quoted uncertainty by the appropriate factor for the normal distribution. The factors corresponding to the above three levels of confidence are 1,64; 1,96; and 2,58 (see also Table G.1 in Annex G).”
If the uncertainty is reported to a particular confidence interval (e.g. 95%), use the associated coverage factor to convert to standard uncertainty.
In the image below is an excerpt from the Fluke 5700A datasheet. You should notice that the specifications are stated for both 95% and 99% confidence intervals.
To find the standard uncertainty, simply divide the published uncertainty by the coverage factor (k) that is associated with the confidence interval stated in the specifications.
If the confidence level is not provided in the specifications (most of the time it is not provided), it is best to assume that it is given to a 95% confidence interval. Only assume a 99% confidence interval if it is stated.
PRO TIP: Next time your auditor suggests that you should evaluate the manufacturer’s accuracy or uncertainty specifications with a rectangular distribution, please refer them to read sections 4.3.3 and 4.3.4 of the GUM.
50/50 Chance of Occurrence
In section 4.3.5 of the GUM, the guide tells you how to evaluate type B uncertainty when you believe that there is a 50% chance of occurrence. The guide recommends that you divide the interval by 1.48.
Therefore, you would use the following equation to convert to standard uncertainty.

“4.3.5 Consider the case where, based on the available information, one can state that “there is a fifty-fifty chance that the value of the input quantity Xi lies in the interval a− to a+” (in other words, the probability that Xi lies within this interval is 0,5 or 50 percent). If it can be assumed that the distribution of possible values of Xi is approximately normal, then the best estimate xi of Xi can be taken to be the midpoint of the interval. Further, if the half-width of the interval is denoted by a = (a+ − a−)/2, one can take u(xi) = 1,48a, because for a normal distribution with expectation μ and standard deviation σ the interval μ ± σ /1,48 encompasses approximately 50 percent of the distribution.”
If you are confused, do not worry. This is not a common occurrence.
I have never encountered a situation where I have had use this technique to evaluate type B uncertainty. Most likely, you will never use it either unless you are performing measurements that can only have two possible outcomes.
2/3 Chance of Occurrence
In section 4.3.6 of the GUM, the guide tells you how to evaluate type B uncertainty when you believe that there is approximately a 67% chance of occurrence. The guide recommends that you divide the interval by 1 because it is close to the conference interval covered by one standard deviation, 68.3%.
Therefore, you would use the following equation to convert to standard uncertainty.

“4.3.6 Consider a case similar to that of 4.3.5 but where, based on the available information, one can state that “there is about a two out of three chance that the value of Xi lies in the interval a− to a+” (in other words, the probability that Xi lies within this interval is about 0,67). One can then reasonably take u(xi) = a, because for a normal distribution with expectation μ and standard deviation σ the interval μ ± σ encompasses about 68,3 percent of the distribution.”
Similar to the 50/50 chance of occurrence, this is not a common evaluation.
I have never encountered a situation where I have had use this technique to evaluate type B uncertainty. Most likely, you will never use it either.
Only Upper and Lower Limits
In section 4.3.7 of the GUM, the guide tells you how to evaluate type B uncertainty when you believe that there is a 100% chance that the value will be between the upper and lower limit.
“4.3.7 In other cases, it may be possible to estimate only bounds (upper and lower limits) for Xi, in particular, to state that “the probability that the value of Xi lies within the interval a− to a+ for all practical purposes is equal to one and the probability that Xi lies outside this interval is essentially zero”. If there is no specific knowledge about the possible values of Xi within the interval, one can only assume that it is equally probable for Xi to lie anywhere within it (a uniform or rectangular distribution of possible values — see 4.4.5 and Figure 2 a). Then xi, the expectation or expected value of Xi, is the midpoint of the interval, xi = (a− + a+)/2, with associated variance…”
In this scenario, the guide recommends that you assign a rectangular distribution and divide the interval by the square-root of 12 or the square root of 3.
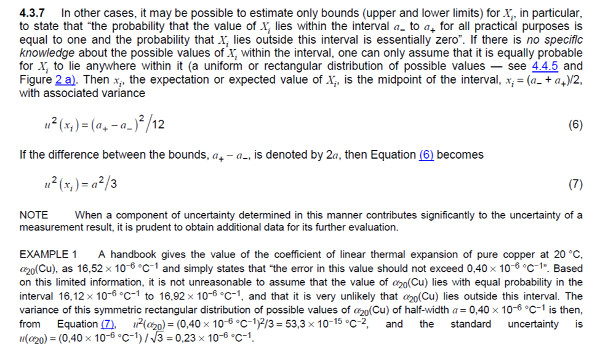
If the value of the mean is expected to be the midpoint of the interval, divide by the square root of 12.

If the difference between of the interval limits is equivalent to 2a, divide by the square root of 3.

If you are not sure how to evaluate the interval, use the second equation and divide by the square root of 3. It is more likely to be the correct evaluation method.
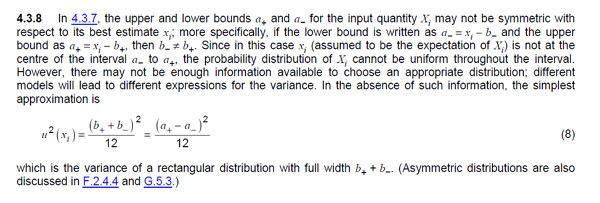
Asymmetrical Limits
Every once in a while, you may encounter specifications or data that is not symmetrically distributed. This means that the limits are not equal for both the upper and lower limits.
“4.3.8 In 4.3.7, the upper and lower bounds a+ and a− for the input quantity Xi may not be symmetric with respect to its best estimate xi; more specifically, if the lower bound is written as a− = xi − b− and the upper bound as a+ = xi − b+, then b− ≠ b+. Since in this case xi (assumed to be the expectation of Xi) is not at the centre of the interval a− to a+, the probability distribution of Xi cannot be uniform throughout the interval. However, there may not be enough information available to choose an appropriate distribution; different models will lead to different expressions for the variance. In the absence of such information, the simplest approximation is…”
For example, the upper limit could be a greater distance from nominal than the lower limit. Look at the image below to see Grade 2 specifications for gage block in accordance with the GGG specification.
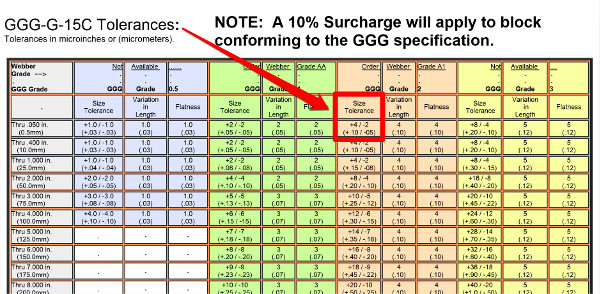
If you notice, the upper and lower limits are not equal in magnitude. Therefore, they are asymmetrical.
When you encounter this type of scenario, the GUM recommends the following instructions to evaluate Type B uncertainty;
If your limits are asymmetrical, subtract the upper limit by the lower limit and divide the result by the square root of 12.

Equal Probability
Now, if you know a thing or two about statistics, then you know that a rectangular distribution is used when all chances of occurrence are equally probable.
However, you probably did not know that you could also use a trapezoidal distribution.
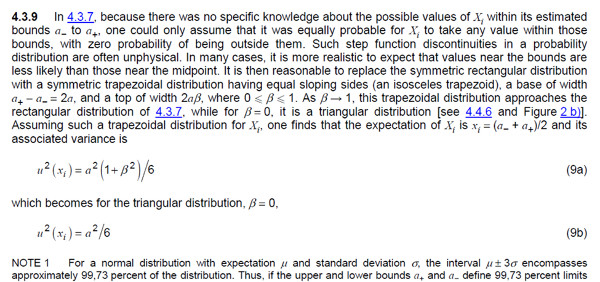
If you did, great. If not, read section 4.3.9 of the GUM.
“4.3.9 In 4.3.7, because there was no specific knowledge about the possible values of Xi within its estimated bounds a− to a+, one could only assume that it was equally probable for Xi to take any value within those bounds, with zero probability of being outside them. Such step function discontinuities in a probability distribution are often unphysical. In many cases, it is more realistic to expect that values near the bounds are less likely than those near the midpoint. It is then reasonable to replace the symmetric rectangular distribution with a symmetric trapezoidal distribution having equal sloping sides (an isosceles trapezoid), a base of width a+ − a− = 2a, and a top of width 2aβ, where 0 < β < 1. As β → 1, this trapezoidal distribution approaches the rectangular distribution of 4.3.7, while for β = 0, it is a triangular distribution [see 4.4.6 and Figure 2 b)]. Assuming such a trapezoidal distribution for Xi, one finds that the expectation of Xi is xi = (a− + a+)/2 and its associated variance is…”
The GUM explains that a rectangular distribution is not always realistic. If you expect values to occur closer to the midpoint and less likely at the limit, then you should use a trapezoidal distribution.
Furthermore, it even provides some additional insight to recommend the use of a triangular distribution.
I think this evaluation of Type B uncertainty is very interesting. It is realistic and practical for most applications where people typically use a rectangular distribution.
However, I do not see it used very often and don’t expect to see many people switching over from rectangular distributions anytime soon.
For those who do, you may enjoy the benefits of a smaller estimate of uncertainty and the additional questioning by your auditors. So, make sure to refer to this section of the GUM to defend using it in your uncertainty budgets.
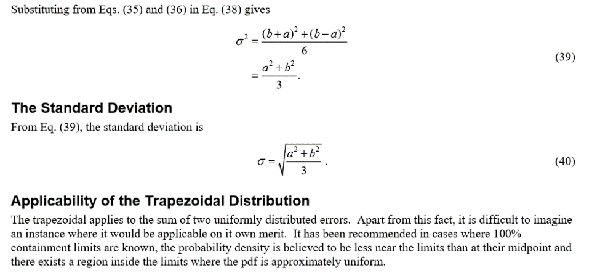
Another good resource is this paper by Howard Castrup. At the bottom of page 15, Howard gives you a good alternative equation for the trapezoidal distribution.
Double-Counting Uncertainty
In uncertainty analysis, there are two common problems; not considering enough sources of uncertainty in your uncertainty budget and double-counting uncertainty components.
Section 4.3.10 of the GUM warns you of double-counting uncertainty to prevent overstated estimates of measurement uncertainty.
“4.3.10 It is important not to “double-count” uncertainty components. If a component of uncertainty arising from a particular effect is obtained from a Type B evaluation, it should be included as an independent component of uncertainty in the calculation of the combined standard uncertainty of the measurement result only to the extent that the effect does not contribute to the observed variability of the observations. This is because the uncertainty due to that portion of the effect that contributes to the observed variability is already included in the component of uncertainty obtained from the statistical analysis of the observations.”
I see double-counting uncertainty components a lot in calibration uncertainty estimates.
For example, a laboratory considers an “ideal” unit-under-test (i.e. UUT) for UUT resolution in their CMC Uncertainty analysis, then includes the actual UUT resolution when calculating calibration uncertainty.
That’s double-counting; and, it happens all of the time.
Even auditors are bad about enticing laboratories to double-count uncertainty components in the very scenario given in the example above.
In fact, I spoke with an assessor this week who wanted to know why the UUT resolution wasn’t included in the CMC Uncertainty calculation. I had to happily refer him to read section 5.4 of the ILAC P14:01/2013.
Another common example of double-counting is when a laboratory includes uncertainty components that would typically be included in the Type A uncertainty components; repeatability and repeatability.
The bad news is it can be difficult to determine if an uncertainty component is already accounted for in another uncertainty component. This means that it is nearly impossible to prevent double-counting uncertainty.
Examples of Evaluating Type B Uncertainty
Evaluating Data From Calibration Reports
Evaluating data from your calibration reports is pretty easy as long as you are getting ISO/IEC 17025 accredited calibrations.
Most accredited calibrations report the measurement result and the associated measurement uncertainty. Additionally, the report will tell you the confidence level the estimated uncertainty; typically, 95% where k=2.
Therefore, all you need to do is divide the reported uncertainty by the expansion factor (k).

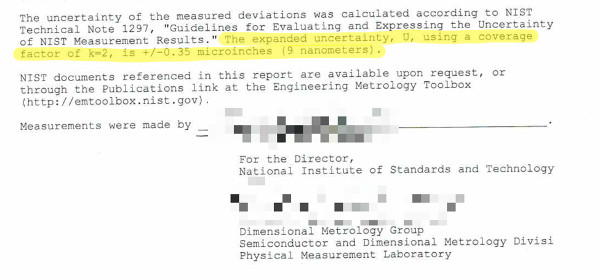
Using the information shown in the calibration report below and the equation given above, you should be able to convert the expanded uncertainty to standard uncertainty.
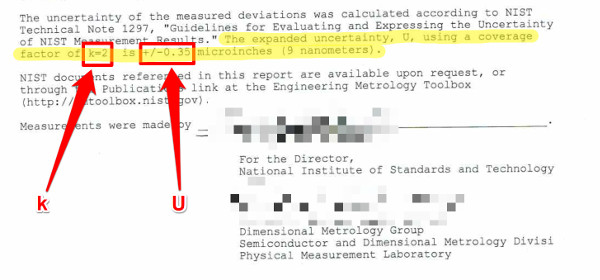
Simply divide the expanded uncertainty (U) by the coverage factor (k). Your result will be the standard uncertainty.

Evaluating Data From Manufacturer’s Specifications
Evaluating data from manufacturer’s specifications is just as easy as evaluating the data from your calibration reports.
Typically, manufacturer’s specifications can be found in manufacturer manuals, datasheets, catalogs, or other marketing materials.
However, not all manufacturers do their due diligence when publishing specifications. So, you may have to make some assumptions.
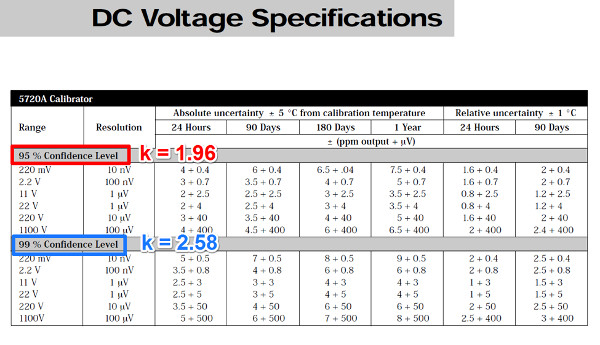
Most credible manufacturers publish specifications with an associated confidence interval. In the image below, you will see that Fluke has published specifications for both 95% and 99% confidence intervals.
For this example, let’s focus on the 95% specification to evaluate a 10V signal using the 11V range.
Looking at the 1 Year absolute uncertainty specification for the 11 volt range, the uncertainty for 10 volts is approximately 38 micro-volts.
Using the information shown in the manufacturer’s specification, use the equation given below to convert the expanded uncertainty to standard uncertainty.
Afterward, your evaluation of Type B uncertainty should be approximately 19.4 micro-volts.

Now, you are probably thinking, “What if the manufacture specifications don’t give a confidence interval?”
The answer is, assume it is stated to a 95% confidence interval and evaluate it similar to the example given above. Feel free to use the values 2 or 1.96 for the coverage factor, k.
Evaluating Data From Guides, Handbook, Papers, & Articles
When evaluating Type B uncertainty, you are not always going to have the convenience of using your own data.
Most laboratories do not have the time or resources required to test every factor that contributes to uncertainty in measurement. Therefore, you are going to use data from other laboratories that have already done the work for you.
The biggest challenge is finding the data! You must put some time and effort into conducting research. To make life easier, I have already created a list of 15 places you can find sources of uncertainty.
Once you find the data and deem it applicable for your measurement process, you can evaluate it for your uncertainty analysis.
Now, you can evaluate Type B uncertainty data in many ways. However, I will focus on the situation that you are going to encounter 90% of the time.
Typically, you are going to find information in a guide, conference paper, or journal article that gives you data with no background information about it.
Therefore, you are most likely to characterize the data with a rectangular distribution and use the following equation to evaluate the uncertainty component.

For example, imagine that you are estimating uncertainty for measuring voltage with a digital Multimeter. You are performing research and stumble upon a paper published by Keysight Technologies that has really good information that is relatable to the measurement process you are estimating uncertainty for.
So, you decide to include some of the information in your uncertainty budget.
The image below is an excerpt from a paper on System Cabling Errors and DC Voltage Measurement Errors in Digital Multimeters published by Keysight Technologies. It contains information on Thermal EMF errors that you want to include in your uncertainty budget.
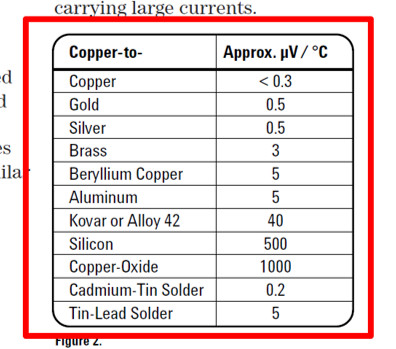
The table in the image has some great information to help you quantify thermal EMF errors, but provides very little information on the origin of the data. Therefore, it would be best to assume that the data has a rectangular distribution.
For a copper-to-copper junction with a temperature change of 1°C, your thermal EMF error should be approximately 0.3 micro-volts. To convert your uncertainty component to standard uncertainty, you would divide the uncertainty component by the square-root of three.

On the other hand, you may find data in a guide, conference paper, or journal article that is normally distributed or has been already converted to standard uncertainty.
Don’t assume all Type B data is rectangular, you will overstate your uncertainty estimates. Look for clues to help you find the right method to evaluate it.
For example, imagine that you are performing research and stumble upon a paper published in the NIST Journal of Research. The study you found has information that is relatable to the measurement process you are estimating uncertainty for.
So, you decide to include some of the information in your uncertainty budget.
The image below is an excerpt from an article on Uncertainty and Dimensional Calibrations by Ted Doiron published in the NIST Journal of Research. It contains data for the elastic deformation of gage blocks calibrated by mechanical comparison that you want to include in your uncertainty budget.
Notice that the paper states that the data is reported as standard uncertainty where k=1.
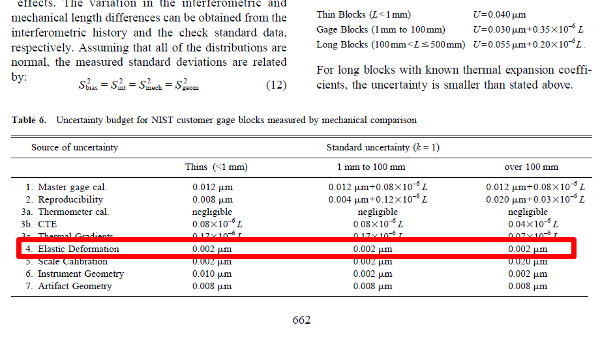
Assuming that the data has a normal distribution and a coverage factor of one, use the equation below to evaluate Type B uncertainty.
Therefore, your evaluation of Type B uncertainty should be approximately 2 micro-meters since your coverage factor (k) is one.

Difference Between Type A and Type B Uncertainty
There is a lot of misinformation on type A and type B uncertainty.
The VIM definitions are the most accurate. Type A uncertainty is evaluated using statistical means. Type B uncertainty is evaluated using other than statistical means.
It is all evaluated by statistical methods. Therefore, the difference is how the data is collected, not how it is evaluated.
Type A uncertainty is collected from a series of observations. Type B data is collected from other sources.
Although Type B uncertainty found in publications may have been collected from a series of observations, it wasn’t collected by you or your laboratory personnel.
Therefore, you are not sure that the data was collected from a series of observations. Furthermore, you do not know how the experiment was conducted.
Experimental results can be manipulated, especially when performed by a group who stands to benefit from the results (e.g. manufacturer, sponsored agency, etc.).
Over the years, many researchers and laboratories have been caught manipulating experiments to achieve results that benefit themselves or their mission. So, you need to be careful.
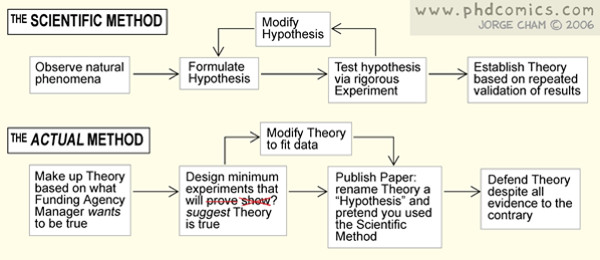
The image below is from phdcomics.com. It was shown to me in grad school when covering the topic of ethics in research. It depicts the realistic manipulation of the scientific method.
How to Choose Type A or Type B
Many people have a hard time trying to decide whether their data is a Type A or Type B uncertainty.
However, it doesn’t have to be a difficult process. In fact, I am going to show you a simple two-step process that will help you choose the correct uncertainty type every time.
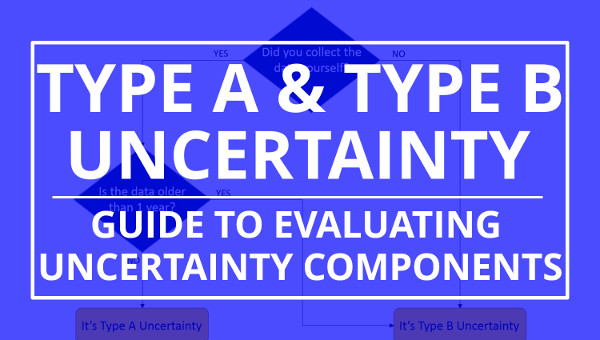
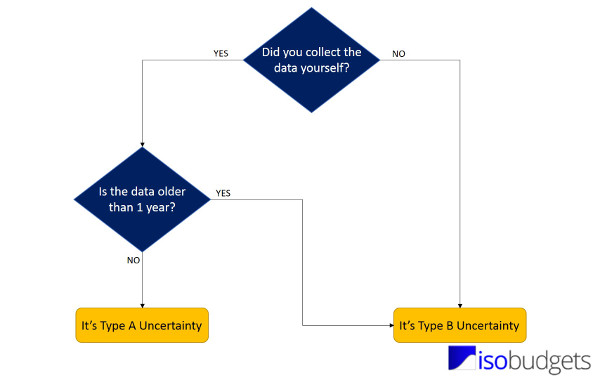
All you have a to do is ask yourself these two questions;
Question 1: Did you collect the data yourself via testing and experimentation?
• If yes, go to question 2.
• If no, choose Type B.
Question 2: Is your data older than 1 year?
• If yes, choose Type B
• If no, choose Type A
I even made you a handy flowchart to help you decide whether your data is Type A or Type B uncertainty.
Think about it. If you collected the data yourself, then you are going to evaluate it statistically. Therefore, it is Type A Data.
However, if you performed a repeatability experiment 5 years ago and still want to include it your uncertainty budget, then it is Type B data.
The age of the data is important. Hence, the reason for question two. You need to routinely update your Type A uncertainty data.
If it is older than a year, then it is most likely Type B data and you should collect more data soon.
Now, there are some exceptions. I have read some repeatability procedures over the years that have recommended that two years’ worth of data should be kept on record at all times.
However, the procedure required that new data should be collected each month which means that the test records included 24 independent sampling events. So, new data was constantly being collected and added to the repeatability records.
In this case, I would consider it Type A uncertainty data.
Don’t stress about picking an uncertainty type, use the two questions listed above and your best judgement. It will help you make the right decision.
Conclusion
Type A uncertainty and Type B uncertainty are two classifications commonly used in uncertainty analysis. Typically used for informational purposes only, they let others know how the data is collected and evaluated.
This guide has covered everything that you need to know about Type A and B uncertainty. It should help you distinguish the difference between the two uncertainty types, so you can select the appropriate method of evaluation for your uncertainty analysis.
So, use the information and give some of these evaluation methods a try. They should help you improve your ability to calculate uncertainty.
Now, leave a comment below and tell me how you choose Type A and Type B uncertainty.


14 Comments