Key Takeaways: Calculating Drift
- Definition: Drift is the slow change in a measurement system’s response over time, independent of the measurand.
- Evaluation Method: Typically evaluated as a Type B component by comparing results from consecutive calibration certificates.
- Formula: $Drift = \text{Current Value} – \text{Previous Value}$ (adjusted for the time interval between calibrations).
- Risk Management: Calculating drift allows labs to predict future performance and adjust calibration intervals to prevent “Out of Tolerance” (OOT) conditions.
- Role in Uncertainty: Drift should be included in your budget if it is significant compared to the expanded uncertainty.
Introduction
Drift is an important source of uncertainty. Typically, it is a significant contributor to uncertainty.
As a result, laboratories should always include the drift or stability of their measurement equipment and(or) standards in their uncertainty budgets. Not including it in an uncertainty analysis is likely to result in an understatement of measurement uncertainty (i.e. reporting smaller uncertainty than you should).
For reference, the following documents recommend evaluating drift and included it in the uncertainty budget;
- EA-04/02 M: 2022 – Evaluation of the Uncertainty of Measurement in Calibration,
- UKAS M3003 – The Expression of Uncertainty and Confidence in Measurement,
- BIPM JCGM 100:2008 – Guide to the Expression of Uncertainty in Measurement
Additionally, drift is required to be evaluated by many standard methods (e.g. ISO, ASTM, etc) and EURAMET calibration guides.
Since drift is an important source of uncertainty, I created this guide to teach you all about it including how to calculate drift so you can estimate uncertainty.
In this guide, I am going to cover the following information:
What is Drift
According to the Vocabulary in Metrology (VIM), drift is the continuous or incremental change over time in indication, due to changes in metrological properties of a measuring instrument.

If you read the definition notes (in the above image), it states that drift is not related to a change in a quantity being measured nor a change of an influence quantity.
Essentially, evaluate drift to determine the change in your equipment or standard’s metrological properties over time. Typically, you will evaluate drift:
- Each time your equipment is calibrated,
- When you estimate uncertainty, and(or)
- When you update your uncertainty budgets.
In either case, you are seeking to determine a change in the metrological property’s value over a specific time interval. Typically, the desired time interval is equal to:
- one year,
- the item’s calibration interval, or
- the item’s period of validity (i.e. until expiration).
Now that you know what drift is, I am going to show you different ways you can calculate it in the next section.
How to Calculate Drift
There are several methods that you can use to calculate the drift of your standards or measurement systems, including:
- Drift based on Specifications, Tolerances, or Maximum Permissible Error
- Drift Since Last Calibration, or
- Average Drift Over Time
In this guide, I am going to show you how to estimate drift uncertainty for the methods listed above. I am going to give you the instructions and formulas to estimate their value. Plus, I have included examples to help you see how the evaluations are performed.
If you need to estimate uncertainty due to stability (instead of drift), you should check out my guide on stability uncertainty.
The evaluations in this guide have been sourced from reputable technical documents, standard methods, uncertainty guides, and the consensus opinions of technical experts and assessors.
Most of these methods have been sourced from:
- Euramet Calibration Guides
- Eurachem CG4 Uncertainty Guide
- ISO & ASTM Methods,
- OEM Equipment Manuals,
- Uncertainty Guides, and
- Textbooks
Method 1: Drift Since Last Calibration
Description
Another common method is to calculate the drift since last calibration. This method is required by some test methods and recommended by several uncertainty guides.
Furthermore, it is commonly recommended by many assessors and experts.
Additionally, it is easy to calculate. Simply find your last two calibration reports and calculate the difference between the two reported results.
This could be the reason why it is so popular.
In the image below, you will see an excerpt from the Euramet CG-18 guide, section 7.1.2.3 which recommends evaluating drift since the last calibration.

In the next image (below), you will see an excerpt from ISO 376:2011, section C.2.5 that recommends estimating drift from previous calibration results.

Lastly, drift since last calibration is considered an “Accurate” estimate of uncertainty in accordance with Appendix E of the JCGM 100:2008. This could give you smaller uncertainties that may benefit your laboratory and its customers. On the contrary, it could give you larger uncertainties (potentially larger than manufacturer specifications) which may make it difficult for the laboratory to meet customer requirements.
In summary, drift since last calibration is an evaluation of uncertainty that is:
- easy to calculate,
- highly recommended, and
- suitable for all levels of competence (i.e. beginner to expert).
Pros and Cons
Using drift since last calibration has its benefits and limitations. Check out the pros and cons of using the method.
The PROS of this method are:
- It is easy to evaluate,
- Highly recommended with support of reputable methods and guides,
- Likely to provide the lab with an accurate CMC uncertainty, and
- The uncertainty is considered “accurate” not “safe” per JCGM 100:2008, Appendix E
The CONS of this method are:
- High risk of overstating or understating uncertainty,
- Does not take into account long-term trends of performance, and
- Need to update uncertainty budgets more frequently.
How to Calculate
In this section, I will list the step-by-step instructions to calculate drift since last calibration for two common methods including:
- Drift when the reference values are the same, or
- Drift when the reference values are not the same.
Method A: Reference Values are the Same
When the reference or standard values in both calibration reports are the same, calculate drift since last calibration following the instructions provided below:
- Review the equipment’s last two (2) calibration reports,
- Find the value being evaluated in both reports,
- Record the results from both reports,
- Calculate the difference between the two results,
- Convert the result to an absolute value,
- Add the result to your uncertainty budget, and
- Reevaluate and update the value after the next calibration.
Method B: Reference Values are not the Same
When the reference or standard values in both calibration reports are not the same, calculate drift since last calibration following the instructions provided below:
- Review the equipment’s last two (2) calibration reports,
- Find the value being evaluated in both reports,
- Record the results from both reports,
- Calculate the difference between the result and the reference value (i.e. error) for the most recent calibration report,
- Calculate the difference between the result and the reference value (i.e. error) for the previous calibration report,
- Calculate the difference between the two errors (i.e. Step 4 minus Step 5),
- Convert the result to an absolute value,
- Add the result to your uncertainty budget, and
- Reevaluate and update the value after the next calibration.
Drift Since Last Calibration Formula
Method A: Reference Values are the Same
Use the formula below to calculate drift since last calibration when the reference values in the calibration certificates are the same (i.e. Method A).
![]()
UD – Uncertainty due to drift
y2 – most recent calibration result
y1 – previous calibration result
To calculate drift since last calibration in Microsoft Excel using method A, use the formula given below.
Method B: Reference Values are not the Same
Use the formula below to calculate drift since last calibration when the reference values in the calibration certificates are not the same (i.e. Method B).
![]()
UD – Uncertainty due to drift
yi2 – most recent calibration result
yref2 – most recent reference value
yi1 – previous calibration result
yref1 – previous reference value
To calculate drift since last calibration in Microsoft Excel using method B, use the formula given below.
Drift Since Last Calibration Examples
In this section, I will show you how to calculate drift since last calibration. You will see two different methods used.
- Method A calculates drift when the reference values are the same.
- Method B calculates drift when the reference values are not the same.
Example 1: Drift Since Last Calibration (Method A)
In this example, I am going to show you how to calculate drift since last calibration when the reference values in both calibration reports are the same.
In the image below, you will see an excerpt from a calibration report showing the reference values (i.e. nominal or standard values) and the calibration results (i.e. your equipment).

Next, I am going to take the calibration results from the most recent calibration report and the previous calibration report and enter them into my drift uncertainty calculator.
Since the reference values are the same, I do not need to make any corrections to the calibration results to properly evaluate them.
In the image below, you will see how I entered the results into the drift calculator.

Now, I will calculate the absolute difference between the calibration results using the formula that I gave you above. The result of the calculation is the drift since last calibration that I would enter into an uncertainty budget.
Look at the image below to see the formula in my drift calculator.

Example 2: Drift Since Last Calibration (Method B)
In this example, I am going to show you how to calculate drift since last calibration when the reference values in both calibration reports are not the same. I added this example because people always ask how to calculate drift when the reference values in their calibration reports do not match.
In the image below, you will notice that the reference values look like actual values instead of nominal values. When you see this, it is common that the reference values in each calibration certificate are not going to be the same.
When the reference values are not the same, you will need to take the reference values into account to calculate drift.
In this example, I will show you how to correct for the change in reference values.

Now, take the most recent and previous calibration results and enter both the reference values and calibration results into the drift calculator.
Look at the image below to see how I entered them into the calculator. The values in the ‘Value 1’ column are from the previous calibration report. The values in the ‘Value 2’ column are from the most recent calibration report.

Next, I will show you how to calculate the absolute difference between the error of each calibration.
First, I calculated the difference between the calibration results and the reference values. In the image below, you will see that take the calibration result in the ‘Value 2’ column and subtract from it the reference value in the same column. This is the error from the most recent calibration report.
Second, I repeated the first step to calculate the error for the previous calibration report (i.e. ‘Value 1’ column).
Third, I calculated the difference between the two errors calculated in the first two steps. The result is the drift since last calibration.
Finally, I converted drift to an absolute value (i.e. convert it to a positive number) and added it to my uncertainty budget.
In the image below, you will see the Excel formula I used to perform the previous steps and calculate drift since last calibration.

Method 2: Average Drift Over Time, Between Calibrations.
Description
Evaluating drift since last calibration can be problematic because the amount of drift each calibration cycle can vary significantly. This is because the evaluated time interval could be too short or the number of data-points is not enough to model long-term behavior. Furthermore, two data-points only provide information about the starting and finishing point but nothing about the behavior in between.
As a result, if your estimated uncertainty is significantly influenced by drift, then:
- Your CMC uncertainty can significantly change after each calibration cycle,
- Your CMC uncertainty can significantly overstated or understated, and(or)
- Your uncertainty budgets need to be updated more frequently.
These problems can be mitigated using more data-points to calculate the average drift over time. Instead of relying on a single evaluation between two events, we can use the law of averages to evaluate the typical or average performance over time.
This will prevent you from:
- overstating uncertainty when a significant amount of drift is observed between two calibrations, or
- understating uncertainty when a relatively small amount of drift is observed between two calibrations.
In my opinion, this method is much better at predicting long-term drift compared to the “Drift Since Last Calibration” method.
I will back this up with an example of a control chart. Would you trust the trend of data with only two data-points in time, or would you feel more confident with a trend evaluated with more than two data-points?
ISO/IEC 17025, section 7.7.1 states that “The laboratory shall have a procedure for monitoring the validity of results. The resulting data shall be recorded in such a way that trends are detectable and, where practicable, statistical techniques shall be applied to review the results.”
Furthermore, ISO/IEC 17025, section 7.7.3 states “Data from monitoring activities shall be analysed, used to control and, if applicable, improve the laboratory’s activities. If the results of the analysis of data from monitoring activities are found to be outside pre-defined criteria, appropriate action shall be taken to prevent incorrect results from being reported.”
Trends are hardly detectable with two data-points in time.
This is why I prefer the average drift over time method
Pros and Cons
Using average drift over time has its benefits and limitations. Check out the below list of pros and cons of using the method.
The PROS of this method are:
- Decreased risk of overstating or understating uncertainty,
- Update uncertainty budgets less frequently,
- Increased confidence in performance trends, and
- Uncertainty is “accurate” per JCGM 100:2008, Appendix E.
The CONS of this method are:
- It is more difficult to calculate (compared to other methods),
- Requires more historical calibration results (compared to other methods),
- Not commonly documented in uncertainty guides and test/calibration methods, and
- May hide or reduce the impact of significant (undesirable) drift in performance.
How to Calculate
To calculate average drift over time, follow the instructions provided below:
- Review the measurement equipment’s last 3 or more calibration/charted results1,
- Find the results associated with the value(s) you are evaluating,
- Record the results from your calibration reports or control charts,
- Calculate the average daily drift rate,
- Calculate the absolute daily drift rate between each calibration interval, and
- Calculate the average of the daily drift rates (from the previous step),
- Determine the number of days in equipment’s calibration interval,
- Multiply the average daily drift rate by the number of days in the calibration interval, and
- Characterize the uncertainty with a Rectangular distribution with a √3 divisor.
The average drift between calibrations is similar to drift since last calibration. Therefore, you should characterize it with a normal distribution where k=1 (i.e. 68.27% C.I.), the recommendation to use the rectangular distribution where the divisor is √3 is based on the consensus of multiple ISO and ASTM methods.
Formula
Below, you will see the formula to calculate average drift over time. In my experience, this is typically calculated using the last 3 to 5 calibration reports for the same reference standard or measurement equipment. Control chart data can be used to calculate the average drift, but is not as common.

UD = drift uncertainty (i.e. average drift over time)
n = number of drift rate evaluations (i.e. 3 calibration results = 2 evaluations)
I = calibration interval in days
yi = evaluated calibration result
yi-1 = previous calibration result
ti = evaluated calibration date
ti-1 = previous calibration date
To calculate average drift between calibrations in Microsoft Excel, use the formula given below. This is the same formula that I use.
Average Drift Over Time Example
In this section, I will show you how to calculate drift based on the average drift over time formula.
For this example, I will use results from three (3) consecutive calibration reports. First, I will find the test-point that needs to be evaluated. Next, I will find and record the result from the most recent calibration report. Then, I will look at the previous two calibration reports and find the results for the same test-point.
For this evaluation, I will calculate the average drift (over the last 3 years) of a multifunction calibrator to generate a 10 DC Volt output.
Find the Last 3 Calibration Reports
In the below image, you will see a collection of three calibration reports with the results I am interested in evaluating the average drift over time. The results to be evaluated are identified with red rectangles.

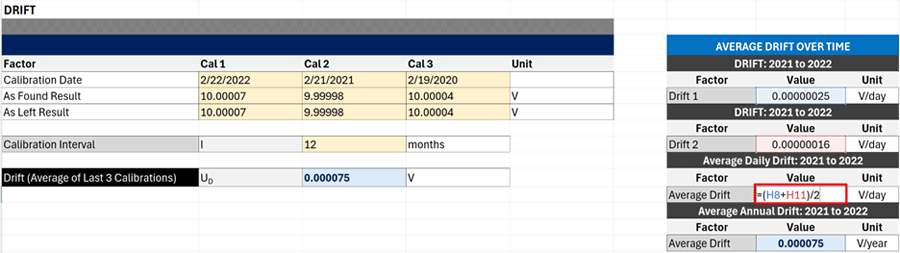
Now that I have the data to be evaluated, I record the results and their associated calibration dates in my Microsoft Excel drift calculator. You will notice that I include both the As Found and As Left results in the calculator.
In the below image, you will see how the data was entered into the drift calculator.

To calculate the average drift, I will break up this process into four parts:
- Calculate the Absolute Daily Drift Rate between the last 2 calibrations,
- Calculate the Absolute Daily Drift Rate between the previous 2 calibrations,
- Calculate the Average Daily Drift Rate,
- Calculate the Predicted Drift based on the current calibration interval.
1. Calculate Absolute Daily Drift Rate #1
First, I calculate the absolute daily drift rate between the last two calibrations. The calibration results evaluated come from the most recent and the previous calibration reports.
To calculate the absolute daily drift rate:
- Calculate the difference between the most recent As Found calibration result and the previous As Left calibration result.
- Convert the calculated difference to an absolute value (i.e. positive value).
- Calculate the number of days between the most recent and the previous calibrations.
- Divide the absolute difference (i.e. Step 2) by the number of days (i.e. Step 3).
The result is the absolute daily drift rate between the most recent and previous calibration.
Record this value. You will need it later.
In the below image, you will see this calculation performed in Microsoft Excel. The formula is provided in the image for your reference.

2. Calculate Absolute Daily Drift Rate #2
Next, I calculate the absolute daily drift rate between the previous two calibrations. The calibration results evaluated come from the previous two calibration reports; the last calibration (i.e. 1 year ago) and the previous calibration (i.e. 2 years ago).
To calculate the absolute daily drift rate:
- Calculate the difference between the last calibration As Found result and the previous calibration As Left result.
- Convert the calculated difference to an absolute value (i.e. positive value).
- Calculate the number of days between the last and the previous calibrations.
- Divide the absolute difference (i.e. Step 2) by the number of days (i.e. Step 3).
The result is the absolute daily drift rate between the last and previous calibration.
Record this value. You will need it in the next step.
In the below image, you will see this calculation performed in Microsoft Excel. The formula is provided in the image for your reference.

3. Calculate Average Daily Drift Rate
Now, calculate the average daily drift rate from the two previously calculated absolute daily drift rates.
To calculate the average daily drift rate:
- Add together the calculated absolute daily drift rates.
- Count the number of calculated absolute daily drift rates (i.e. 2 in this example).
- Divide the SUM of absolute daily drift rates (i.e. Step 1) by the Number of calculated absolute daily drift rates (i.e. Step 2).
The result is the average daily drift rate over the evaluated calibration intervals.
Record this value. You will need it in the next step.
In the below image, you will see this calculation performed in Microsoft Excel. The formula is provided in the image for your reference.
4. Calculate Average Drift Between Calibration
Finally, calculate the average drift between calibrations.
To calculate the average drift between calibrations:
- Determine the number of days in your calibration interval (See the table below).
- Multiply the average daily drift rate by the number of days in your calibration interval.

The result is the average drift between calibrations of the average drift expected to occur during the current calibration interval.
Add this value to your uncertainty budget for Drift.
In the below image, you will see this calculation performed in Microsoft Excel. The formula is provided in the image for your reference. The evaluation was performed for a 1 year (i.e. 12 month) calibration interval which has 365.25 days/year.

Method 3: Drift Using Specifications, Tolerance, Accuracy, and MPE
Description
An easy way to determine drift for your uncertainty analysis is to use manufacturer accuracy specifications, calibration tolerances, or maximum permissible error.
Simply, find these uncertainties by looking at:
- Equipment manuals and datasheets,
- Calibration certificates, and(or)
- Standards documents and methods.
The easiness of the method makes it a popular choice for beginners to estimate uncertainty and labs with customers that do not require results with small uncertainties.
However, this is a conservative method that provides a “Safe” uncertainty because the estimate is considered a deliberate overstatement of uncertainty based on an expected worst case scenario.
To use this method, you need to make the following assumptions about equipment performance:
- Equipment performance remains within the tolerance interval between calibrations, and
- Equipment performance is unpredictable between the upper and lower tolerance limits, including at the tolerance limits.
In my opinion, this is a reasonable assumption if you have new equipment with only one calibration report. However, this may not be acceptable for equipment or standards that have an adequate amount calibration history (where trends can be determined and evaluated).
Most standards and equipment are not likely to drift an amount equal to the tolerance. Therefore, using this method could significantly overstate your measurement uncertainty.
According to the JCGM 100:2008, Appendix E, the GUM recommends the use of accurate uncertainties rather than safe uncertainties.
Look at the image below to learn why the GUM recommends “accurate” rather than “safe” uncertainties. Read the following:
- Section E.1.1,
- Section E.1.2, and
- Section E.2.1.

Contrary to the GUM, using specifications, tolerances, and(or) MPE is a method highly recommended by manufacturers, accreditation body trainers, assessors, reputable technical guides, and (even) standard methods. Based on consensus, you should be able to use this method to estimate drift without fear of a nonconformity.
I see this technique used all of the time. To date, I have not seen an assessor cite a deficiency (yet) for using this method to evaluate drift. Most likely, they were trained to use this method themselves.
Pros and Cons
Using specifications, tolerances, and MPE has its benefits and limitations. Check out the below list of pros and cons of using the method.
The PROS of this method are:
- It’s easy to evaluate,
- Decreased risk of understating uncertainty, and
- Update uncertainty budgets less frequently.
The CONS of this method are:
- The uncertainty is “safe,” not “accurate” per JCGM 100:2008, Appendix E
- Increased risk of overstating uncertainty,
- Increased risk of false rejects (i.e. producer’s risk),
- Lower Test Uncertainty Ratio and Measurement Capability Index, and
- May impact lab’s ability to meet customer requirements1.
Overstated uncertainties can impact laboratory performance and the ability to meet customer requirements. The list below provides some of the risks associated with overstated uncertainties.
- Decrease test uncertainty ratio,
- Decrease measurement capability index,
- Incorrect conformity decisions based on the lab’s decision rules,
- Decision rules and the amount of risk taken into account,
- Imbalance between producer and consumer risk.
How to Find Drift from Specifications, Tolerances, or MPE
To find drift, follow the instructions provided below:
- Look up the following:
- Accuracy or uncertainty specifications in manufacturer manuals or datasheets,
- Drift specifications in manufacturer manuals or datasheets,
- Tolerance limits in methods or calibration certificates, and(or)
- Maximum Permissible Error in standards, methods or calibration certificates.
- Find the value or formula associated with the measurement function, range, and value being evaluated,
- If the specification is a formula, calculate the uncertainty associated with the value being evaluated. Otherwise, skip this step.
- Add the specification, tolerance, or maximum permissible error to your uncertainty budget.
Examples of Drift Based on Specifications, Tolerance, Accuracy, and MPE
In the following sections (below), I am going to show you several examples of using specifications, tolerances, or MPE to evaluate drift.
Example 1: Accuracy Specification for a Fluke Calibrator

The first example I am going to show you is using the manufacturer’s accuracy or uncertainty specifications to calculate drift. In the above image, you will notice that I highlighted the absolute uncertainty specifications with a red rectangle.
If I wanted to use the absolute uncertainty specification (instead of calculating drift), then I would find the formula associated with the value that I above evaluating and calculate the absolute uncertainty associated with the measurand that I am evaluating.
Let’s imagine I need to determine the one-year drift for 329 mV. The formula in the above specifications is 20 ppm + 1 µV. Now, I need to use the formula to calculate my drift uncertainty.
- Step 1: First, I set-up the formula as shown in the example below.
- Step 2: Next, I multiply the gain coefficient (i.e. slope), 20 ppm, and the measurement value, 329 mV.
- Step 3: Then, add the offset coefficient (i.e. y intercept), 1 µV, to the result from the previous step.
- Step 4: Finally, round the result to the same number of significant digits as the instrument resolution.

The result is the specification that I would use for drift and add to my uncertainty budget.
Additionally, in the above example, take notice that you may have to convert values to make sure they are all the same unit of measure and order of magnitude.
Example 2: Tolerance of a Gauge Block
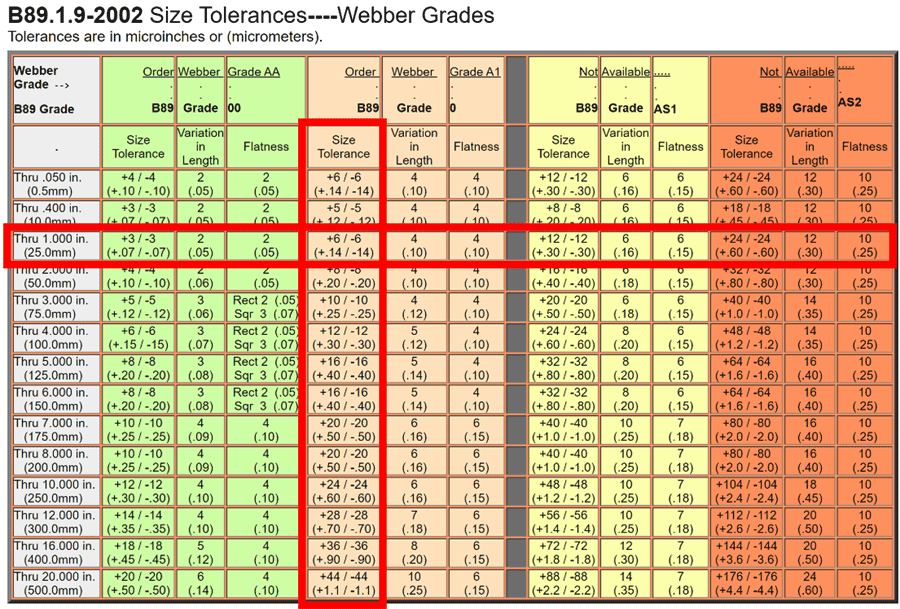
In this example, I am going to estimate drift based on tolerances in the above table. The ASTM B89.1.9, or ISO 3650, is the standard for the metrological characteristics of gage blocks that includes the deviation limits and tolerances based on the size and grade of a gage block.
So, if I know the size and grade of my gage blocks, then I look at the tolerance tables to find drift.
Now, imagine I have a grade 0, one inch gage block. First, I look at the above table and find the Grade 0 column. Next, I look at the rows (on the left side of the table) to find the size range my gauge block is within. Finally, I look at the table to find where the column and row intersect to find the gauge block tolerance.
In this example, the table shows us a grade 0, one inch gage block has a size tolerance of ±6 µin.
This is the value I will add to my uncertainty budget to quantify drift.
Example 3: Maximum Permissible Error of a Calibrated Mass

In this example, I evaluated the drift of a calibrated mass using the maximum permissible error from a tolerance table.
Let’s imagine I have an ASTM Class 1, 100 g mass. To find the maximum permissible error associated with my mass, I performed the following steps:
- Look up the ANSI/ASTM E617 tolerance tables,
- At the top of the table, find the column that matches the mass’s assigned class,
- On the left-hand side of the table, find the row that matches the mass’s assigned value,
- Find where the column and row intersect to get the mass’s maximum permissible error.
Note: If you have OIML masses, you will want to look up the OIML R111 tolerance tables.
The above table shows an ASTM class 1, 100 gram mass has a maximum permissible error of ±0.25 mg.
This value will be used to estimate uncertainty related to the mass’s drift and added to my uncertainty budget.
Example 4: Tolerance or Maximum Permissible Error of a Calibration Report

In this example, I evaluated the drift of a calibrated mass using the maximum permissible error from a calibration certificate.
Let’s imagine I have an ASTM Class 1, 1 g mass. To find the maximum permissible error associated with my mass, I performed the following steps:
- Look at the most recent calibration report,
- Find the row that matches the calibrated mass being evaluated,
- Find the column that contains the mass’s maximum permissible error,
- Find where the column and row intersect to get the mass’s maximum permissible error.
The above certificate shows an ASTM class 1, 1 gram mass has a maximum permissible error of ±0.034 mg.
This value will be used to estimate uncertainty related to the mass’s drift and added to my uncertainty budget.
If your lab calibrates scales and balances, then this is consistent with Euramet CG-18 and OIML R111. The guides recommend using the mass’s maximum permissible error to evaluate drift (if consecutive calibration results are not available).
Example 5: Accuracy, Specification, or Tolerances from a Calibration Report

In this example, I evaluated the drift of a pressure transducer using the specification/tolerance from a calibration certificate.
Let’s imagine I have a 7MPa pressure transducer and we are evaluating uncertainty at 7MPa (i.e. 7000 kPa in the above image). To find the specification/tolerance associated, I performed the following steps:
- Look up the item’s most recent calibration certificate,
- In the report, find the calibration results for the value being evaluated,
- Find the specification or tolerances (e.g. Upper and Lower Limits).
- If necessary, evaluate the tolerance as one-half the tolerance interval (see formula below). Otherwise, use the reported specification value.
In the above image, you will see (in the red rectangle) that the calibration report provides the specifications for each test points. Therefore, I can add the specification for 7000 kPa directly to my uncertainty without any additional calculations.
However, most calibration reports do not state the specification. Instead, they report the upper and lower tolerance limits. In this scenario, you will need to use the tolerance limits to calculate the specification before adding it to your uncertainty.
Below, you will see the formula that I recommend using to calculate the specification. You can find this recommendation supported in the JCGM 100:2008 (GUM), sections 4.3.7 and 4.3.8. It works for both symmetrical and asymmetrical tolerance intervals.
Formula
Use the below formula to calculate the drift uncertainty based on upper and lower tolerance limits (typically found in calibration reports).

UD – Drift Uncertainty
TLU – Upper Tolerance Limit
TLL – Lower Tolerance Limit
In the image below, you will see a calibration report that includes the upper and lower tolerance limits. Additionally, you will see the accuracy associated with each test-point listed as well.
With this data, you could use the reported accuracy as the drift uncertainty; or, you could use the tolerance limits and the above formula to calculate the drift uncertainty. The results should be the same as the reported accuracy.

After determining the drift uncertainty from either the accuracy, specifications, and(or) tolerances given in a calibration report, I can add it to my uncertainty budget.
What Method Should You Use
After learning about each of these methods, you may be wondering which one you should use. Well, the answer is the method that you prefer to use and that meets your requirements.
However, I will provide some recommendations based on the following situations:
- Test or Calibration Method,
- Number of Calibration Reports (i.e. Calibration History),
- Established Risk Levels, and
- Customer Expectations/Requirements.
Test or Calibration Method
First, evaluate drift based on the selected test or calibration method. If the method specifies how drift should be evaluated, then follow what is specified in the method. Otherwise, you will have a nonconformity.
Number of Calibration Reports
The most common question people ask me is how to calculate drift with only one or two calibration reports. Well, if you have:
- One Calibration Report: evaluate drift based on specifications, tolerances, or MPE,
- Two Calibration Reports: evaluate drift using Drift Since Last Calibration method, and
- Three or More Calibration Reports: evaluate drift using Average Drift Over Time method.
Established Risk Levels
You can evaluate uncertainty based on the level of risk.
- Lower Risk (Safe): evaluate drift based on specifications, tolerances, or MPE,
- Higher Risk: evaluate drift using:
- Drift Since Last Calibration method, or
- Average Drift Over Time method.
Lower risk should be associated with a lower risk of understating uncertainty by choosing to potentially overstate measurement uncertainty.
On the other hand, higher risk should be associated with a higher risk of understating uncertainty by choosing to evaluate a more accurate estimate of measurement uncertainty.
Both scenarios have their own associated risks. So, make sure to take them into consideration.
Customer Requirements
Make sure that your reported measurement uncertainty are capable of meeting customer requirements. Your estimated uncertainty can affect your:
- Test Uncertainty Ratio,
- Measurement Capability Index, and
- Decision Rules.
Therefore, make sure the methods you use to evaluate measurement uncertainty do not impact these factors because it can affect your ability to meet customer requirements.
Overall, any of the methods in this guide are appropriate to calculate drift. The method you select should take into consideration the above listed criteria. Furthermore, you do not have to commit yourself to just one of these methods. You can use switch methods for different uncertainty analyses since the above criteria can change for different test and(or) calibration activities.
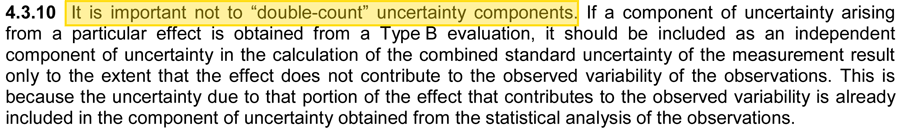
Double Counting Uncertainty
WARNING: Do not overstate your uncertainty.
It is common for people to confuse the terms drift and stability. Many people, including experts, use terms interchangeably.
First, they are not the same.
Second, do not include both factors in the same uncertainty budget.
Drift and Stability can confound each other because they may evaluate the same set of data using different techniques. Therefore, you will likely end up double-counting uncertainty and unintentionally overstate your measurement uncertainty.
Make sure to include either Stability or Drift, but not both, in your uncertainty budgets.
Please make sure to review your uncertainty budgets are avoid including both drift and stability in the same budget. Only include Stability or Drift, but not both, in your uncertainty budgets.
Furthermore, it should be noted (from the above GUM excerpt) that manufacturer specifications typically include contributions due to repeatability, reference standard uncertainty, and(or) resolution. Including these contributors again in your uncertainty budgets is a likely cause of overstating uncertainty.
If the manufacturer publishes specifications for repeatability, reference standard uncertainty, and(or) resolution and states that they are included in the accuracy specification, then consider removing the contribution from the manufacturer specification to avoid overstating measurement uncertainty. You can use the sum of square of deviations to remove their contribution if you know their magnitude.
Conclusion
In this guide you should have learned all about drift and how it affects measurement uncertainty.
I covered the following topics:
- What is drift,
- Why drift is important,
- How to calculate drift,
- Examples of estimating uncertainty due to drift,
- What method to use, and
- Double-counting uncertainty.
With this information, you should be able to confidently evaluate drift and add the results to your uncertainty budget.
Drift is an important contributor to measurement uncertainty. Sometimes, it is the most significant contributor. So, make sure to evaluate the drift of your measurement equipment and reference standards. Omitting it from your analysis will likely cause you to understate your uncertainty.