
Introduction
Linearity uncertainty (a.k.a. linearity error or non-linearity) is a source of uncertainty that should be included in most uncertainty budgets. It is a common characteristic published in the manufacturer’s specifications for various types of measurement equipment. However, I do not see it included in uncertainty budgets as often as it should be.
If you have a test or measurement function that spans across a range of values, then you may need to include linearity in your uncertainty analysis. Therefore, I thought that it would be a great idea to develop a guide to show you how to estimate linearity uncertainty step by step using Microsoft Excel.
In this guide, you are going to learn everything that you need to know about linearity uncertainty, including;
- What is Linearity Uncertainty
- Why is Linearity Uncertainty Important
- When Should You Include Linearity Uncertainty
- Linearity Uncertainty Methods
- Which Uncertainty Method You Should use
- How to Calculate Linearity Uncertainty (Step By Step)
What is Linearity Uncertainty
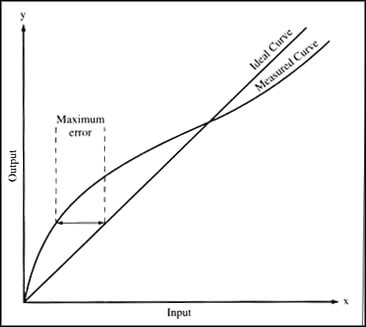
Linearity is the property of a mathematical relationship or function that can be graphically represented as a straight line.
Non-linearity is the deviation from a straight line over a desired range.
Therefore, linearity uncertainty would the uncertainty associated with non-linear behavior observed across the range of an assumed linear function.
When you think about how measurement equipment functions, you probably assume that its measurement performance is linear across the measurement range.
However, this is not typically the case.
The measurement functions of most devices are not actually linear. Instead, they are approximately linear. So, we try to correct them with coefficients and linear or polynomial equations to make their performance more predictable.
Still, prediction equations and coefficients do fully correct for their non-linear behavior. Therefore, we must take linearity uncertainty into consideration.
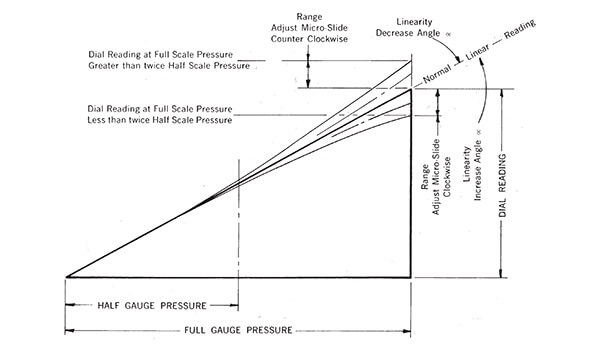
Non-linear behavior is most commonly observed for many mechanical devices and physical materials. For example, here is a list of devices that are commonly evaluated for linearity;
- Pressure Gauges (with bourdon tubes)
- Pressure Transducers (with strain gauges)
- Load cells,
- Force gauges,
- Scales and analytical balances,
- Torque transducers,
- Resistance Thermometers (e.g. PRT, RTD, thermistors, etc.),
- Liquid in glass thermometers (e.g. mercury, spirit-filled, etc.),
- Hygrometers,
- Dial indicators,
- and much more.
Additionally, many electrical devices can exhibit non-linear behavior too.
- Digital Multimeters,
- Multifunction Calibrators,
- Oscilloscopes,
- LCR Meters,
- Phase Meters,
- Thermocouple Simulators,
- Power Sensors,
- Signal Generators,
- and much more.
No matter what type of equipment you are using, do not forget to consider linearity in your uncertainty analysis unless it is negligible or inappropriate to do so.
Why is Linearity Uncertainty Important
Linearity uncertainty is important because it allows you to consider the effects of non-linear behavior in a measurement function. If you use an equation to estimate uncertainty across a measurement range, then you may need to consider evaluating linearity uncertainty.
I often hear people say that linearity is not important or doesn’t need to be included in an uncertainty budget. I say, test it and let the results speak for themselves.
If the result is small or negligible, great! Now, you have objective evidence to support your opinion. However, I would still include it your uncertainty budget to prove you considered it.
If the result is significant, then include the results in your uncertainty budget.
If you are unable to calculate linearity, try reading the manufacturer’s manuals and datasheets to see if they list it in the specifications.
Nonetheless, linearity uncertainty is important. At least consider whether or not it affects your measurement uncertainty.
When Should You Include Linearity Uncertainty
You should include linearity in your uncertainty analysis anytime you are estimating uncertainty for a continuous measurement range.
If you plan to use a linear equation to predict the measurement uncertainty of a given measurement range, then you should include linearity into your uncertainty analysis.
When estimating measurement uncertainty across a measurement range, you will typically estimate uncertainty at test-points close to the minimum and maximum of the measurement range. Since your uncertainty analysis doesn’t estimate uncertainty at the points in between the minimum and maximum values, you need to take non-linearity of the function into consideration.
Additionally, many measurement instruments exhibit non-linear behavior below 10% of the measurement range. When you estimate uncertainty for values below 10% of the measurement range, you are more likely to see non-linear behavior the closer you get to zero.
So, be sure to take that into consideration when selecting test-points for your uncertainty analysis.
Linearity Uncertainty Methods
There are two common methods that you can use when estimating linearity uncertainty. They are;
- Maximum Deviation from Linearity
- Typical Deviation from Linearity
Method 1: Maximum Deviation from Linearity
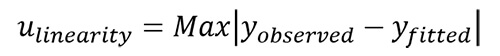
Maximum error provides the maximum deviation from the linear behavior of a fitted line prediction equation (e.g. regression, interpolation, B.F.S.L.).
Method 2: Standard Error from Linearity
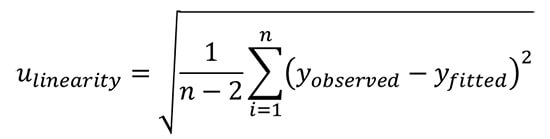
Standard error provides the typical deviation from the linear behavior of a fitted line prediction equation (e.g. regression, interpolation, B.F.S.L.).
Both methods evaluate the deviation from linearity. The difference between the two methods is one method evaluates the worst case scenario and the other evaluates the most likely or most probable scenario.
Which Uncertainty Should You Use: Max or Standard
The maximum deviation method is the most commonly used method for evaluating linearity uncertainty. Additionally, it is the most recommended method. If you decide to do some research, you are more likely to find information on the maximum deviation method.
NIST recommends the maximum deviation method in their NIST/SEMATECH Engineering Statistics Handbook. See the excerpt provided below.
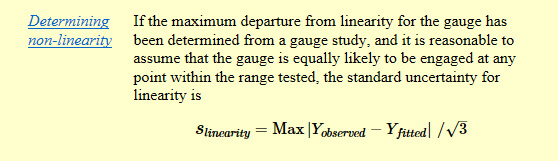
When evaluating linearity uncertainty, I prefer to use the standard error method. I believe that it is more applicable to an uncertainty analysis and the development of a CMC Uncertainty predication equation, especially if I have already considered bias or error in my uncertainty analysis.
If you choose to use the maximum deviation for linearity, you need to be careful not to confound your results and overstate your estimated measurement uncertainty.
When you include bias or error in your uncertainty analysis, you are more likely to overstate your uncertainty using the maximum deviation method. Especially, since the maximum deviation and bias could end up being the same result!
If you choose to use the standard error method, you are more likely to understate your measurement uncertainty if you do not include bias in your uncertainty budget.
When you include bias in your uncertainty analysis, using the standard error for linearity uncertainty is more likely to give you a better estimate of uncertainty in measurement.
So, use the method you like best. At least you should know what options you have available and why you selected to use the method you have chosen if anyone ever asks you a question.
How to Calculate Linearity Uncertainty
To calculate linearity uncertainty, I am going to show you how to perform regression analysis in Microsoft Excel and find the maximum deviation and standard error.
In Microsoft Excel, there are two processes that you can use to easily use to get results;
- Data Analysis ToolPak, and
- LINEST and INTERCEPT functions.
Finding Linearity Uncertainty with Data Analysis ToolPak
In this section, you will learn how to use Data Analysis ToolPak to find your linearity uncertainty following the four steps below;
- Install Data Analysis ToolPak,
- Enter Your Standard and UUT Data,
- Perform Regression Analysis, and
- Find your Linearity Uncertainty
1. Install Data Analysis ToolPak
To calculate linearity uncertainty, you will need to perform regression analysis. To do this in Microsoft Excel, you will need to install Data Analysis Tool Pack.
Since this add-in comes built into Microsoft Excel, all you need to do is activate it. To activate Data Analysis Tool Pack, follow the steps below:
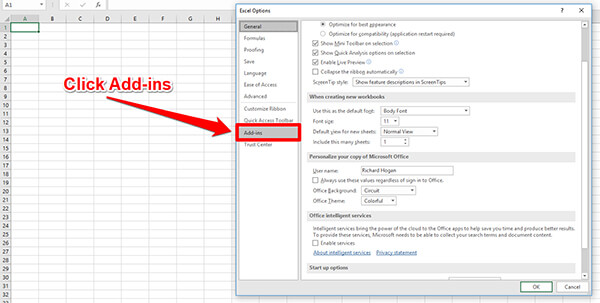
a. Click the File tab

b. Click Options (on the left side panel)

c. A new window will open. Click Add-ins.
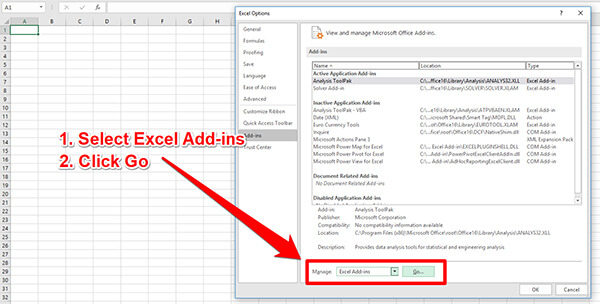
d. At the bottom of the screen, use the drop-down menu to select Excel Add-ins, then click the Go button.
e. Check the box next to Analysis ToolPak, then click the Ok button.
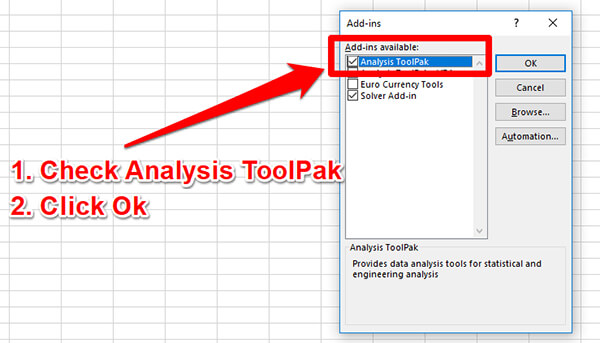
Data Analysis ToolPak will be added to Microsoft Excel. You can add under the Data tab.
2. Enter Your Standard and UUT Data
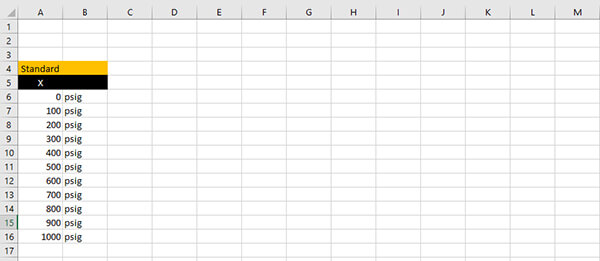
a. Enter your Nominal Values into column X
Now that Data Analysis ToolPak is added to Microsoft Excel, pick a column and enter your nominal or standard values. You want to use all of test-points calibrated for the measurement range you are evaluating linearity uncertainty.
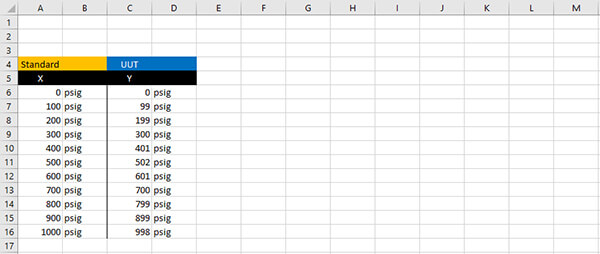
b. Enter Your Actual Values into column Y
Next, select another column and enter the calibration results for the unit under test (UUT).
3. Perform Regression Analysis
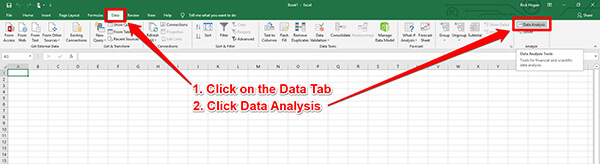
a. Open Data Analysis ToolPak
Now, we are going to put Data Analysis ToolPak to work. Click on the Data tab. Look at the right-side of the toolbar and click on the Data Analysis button.
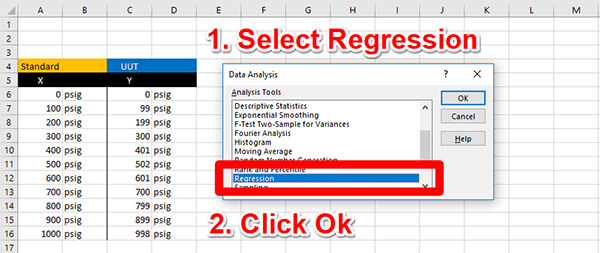
b. Select Regression Analysis
A new window will open with a list of analyses. Scroll down and select Regression Analysis. Then, click the Ok button.
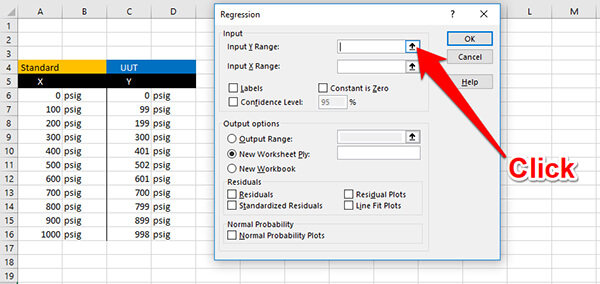
c. Select Column Y
A new window will open that requires you to enter information needed to perform regression analysis. In the Input section, find the Input Y Range cell and click the button to the right of the cell.
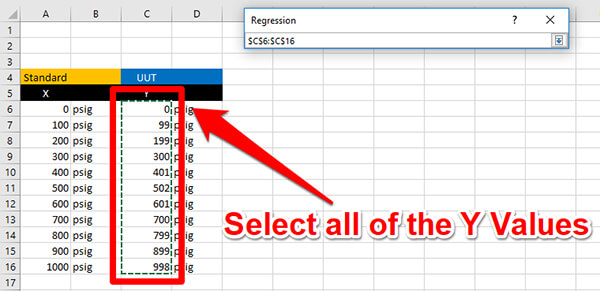
Select all of the cells that contain the UUT calibration results.
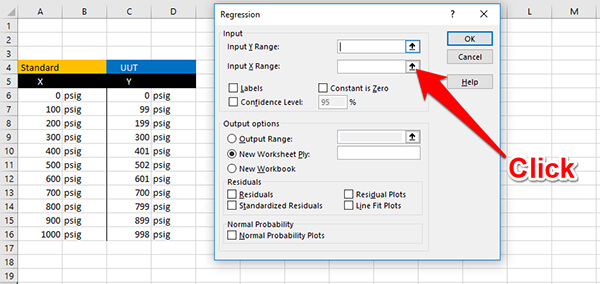
d. Select Column X
Find the Input X Range cell and click the button to the right of the cell.
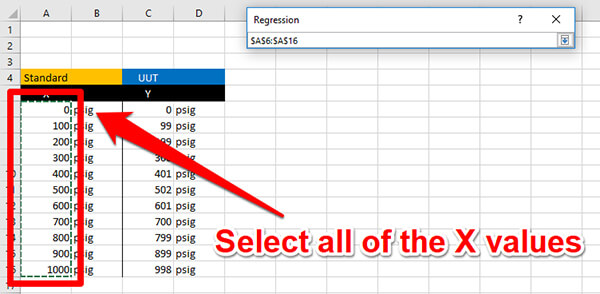
Select all of the cells that contain the Nominal or Standard values.
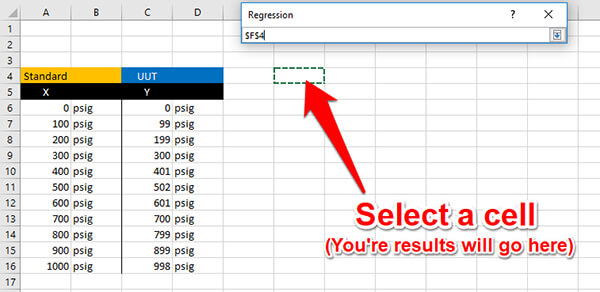
e. Select a Location For the Results
In the Output Options section, select the Output Range and click the button to the right of the input cell.
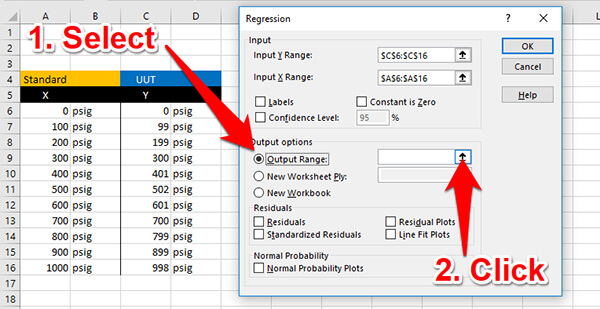
Select a cell where you would like the results reported. I recommend choosing a section to the right or below your data table. The results of regression will fill in a lot of cells, so make sure not to overwrite any of your data.
f. Click to Show Residuals
In the Residuals section, check the box to show Residuals.
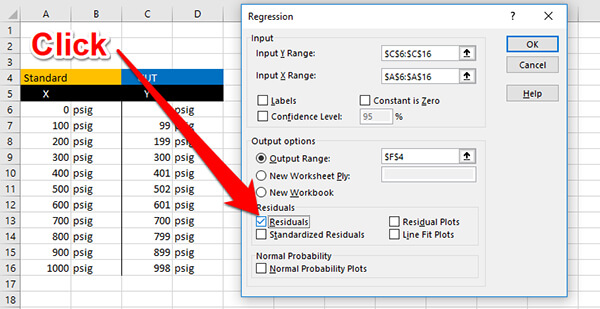
g. Click Ok to Perform The Analysis
Finally, click the Ok button to perform a regression analysis. After you click the button, Microsoft Excel will perform regression analysis and show you the results.
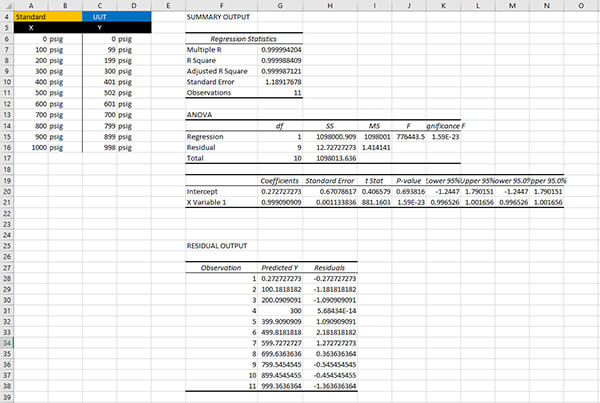
4. Find Linearity Uncertainty
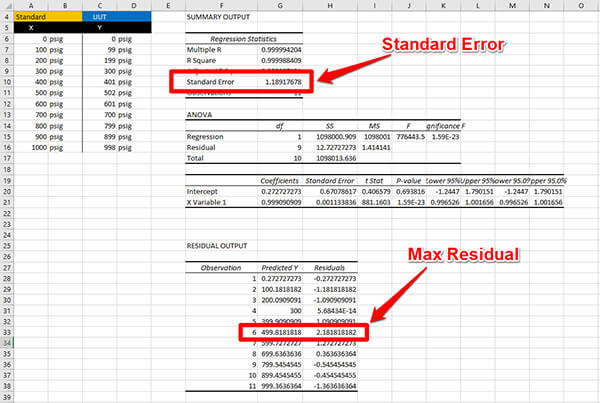
a. Find the Standard Error or the Max Residual
For linearity uncertainty, you will want to look at the Standard Error or the Maximum Residual. The method that you prefer to use to evaluate linearity will determine which data you will enter into your uncertainty budget.
Finding Linearity Uncertainty with LINEST and INTERCEPT
In this section, you will learn how to use the LINEST and INTERCEPT functions to calculate your linearity uncertainty following the four steps below;
- Enter Your Standard and UUT Data,
- Calculate the Gain Coefficient,
- Calculate the Offset Coefficient,
- Calculate your Fitted Prediction Line,
- Calculate the Residuals, and
- Find your Linearity Uncertainty
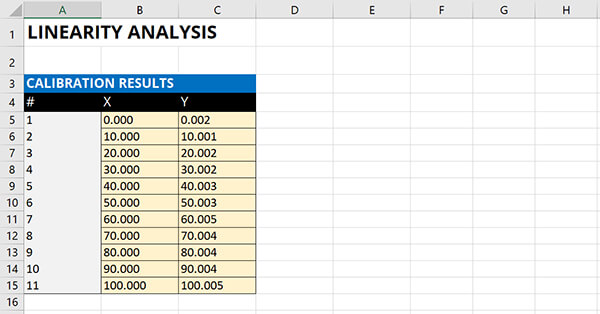
1. Enter Your Standard and UUT Results
First, create a table and enter your standard or nominal values in column X. Then, enter your results in column Y.
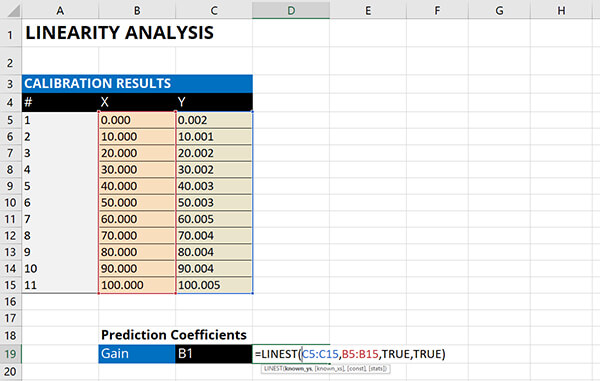
2. Calculate the Gain Coefficient
Calculate the Gain Coefficient (i.e. slope) using the LINEST function in Microsoft Excel.
- Type “=LINEST(“
- Select all the cells in the Y column,
- Select all the cells in the X Column,
- Type “True” because the offset coefficient will be calculated normally,
- Type “True” for additional regression statistics,
- Type “)” and hit the Enter key.
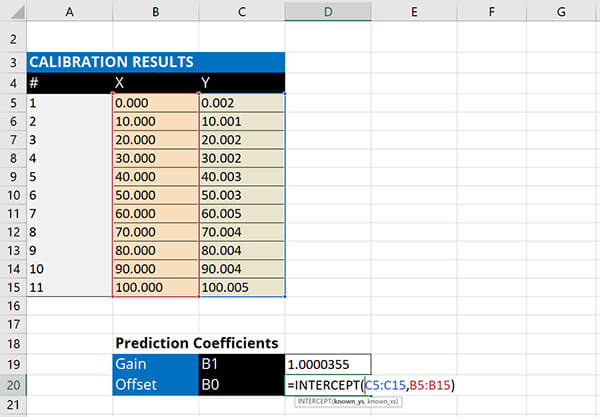
3. Calculate the Offset Coefficient
Calculate the Offset Coefficient (i.e. y-intercept) using the INTERCEPT function in Microsoft Excel.
- Type “=INTERCEPT(“
- Select all the cells in the Y column,
- Select all the cells in the X Column,
- Type “)” and hit the Enter key.
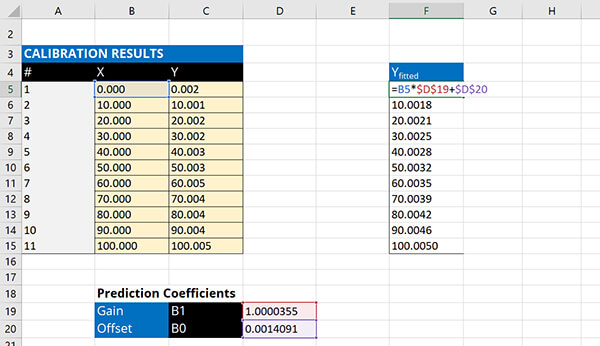
4. Calculate the Fitted Straight Line
Calculate the fitted straight line using the gain and offset coefficients.
- Type “=”
- Select the first value in the X column,
- Multiply it by the Gain Coefficient,
- Add the Offset Coefficient,
- Hit the Enter key
- Copy and paste for the remaining values in the X column.
Hint: Hit the F4 key when you select the coefficient cells to lock the cells when you copy and paste equations.
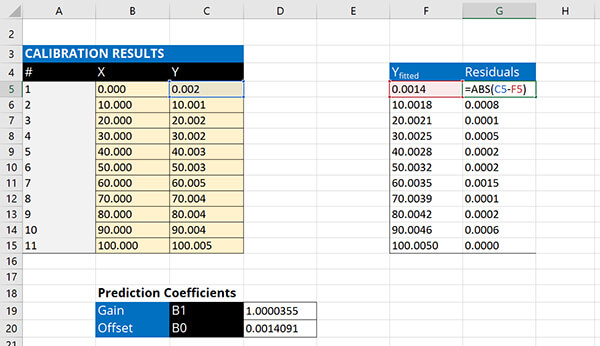
5. Calculate the Residuals
Calculate the residuals by calculating the difference between the observed Y result and the fitted Y result.
- Type “=ABS(“
- Subtract the first cell in the Y column by the first cell in the Y-fitted column,
- Type “)” and hit the Enter key.
- Copy and paste for the remaining values in the Y column
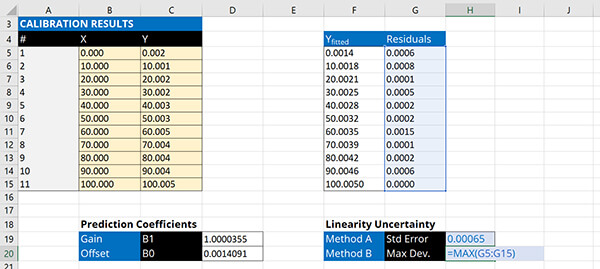
6. Find the Linearity Uncertainty
Calculate the standard error and the maximum deviation to find the linearity uncertainty.
a. Standard Error
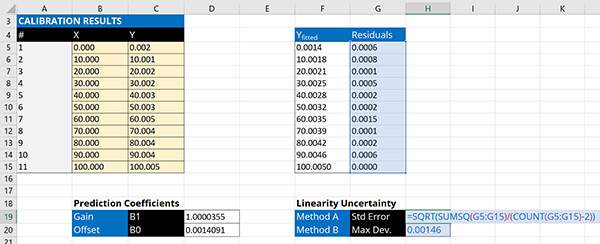
b. Maximum Deviation
Conclusion
Linearity uncertainty is an important source of uncertainty that you may want to include in your uncertainty analyses. If you are using prediction equations for your CMC Uncertainty and your measurement function spans across a range of values, you might want to add linearity to your uncertainty budgets to account for the non-linearity in your measurement function.
In this guide, you should have learned;
- What is linearity uncertainty,
- Two methods for calculating linearity uncertainty,
- How to calculate it, and
- When to include it in your uncertainty budgets.
Give these methods a try and let me know which method you prefer to use. Plus, let me know what additional examples you would like me to add to the guide.