Introduction
Calculating measurement uncertainty in microbiology labs has become quite a challenge. With the enforcement of the Food Safety Modernization Act, there has been a significant increase in the number food microbiology labs seeking ISO/IEC 17025 accreditation. However, there is not a lot of helpful information, guides, and courses available to teach measurement uncertainty to microbiology labs.
Therefore, I have created this guide to help food microbiology labs learn to calculate measurement uncertainty.
Food Microbiology and ISO/IEC 17025 Accreditation
In 2011, the Food Safety Modernization Act was signed into law to enforce new regulations that ensure food safety. One of the requirements mandated that food testing be performed by ISO/IEC 17025 accredited laboratories and directed the FDA to establish a compliance program.
In 2015, the FDA authorized the use of third party certification bodies to perform food safety audits.
As a result, the number of food microbiology labs seeking ISO/IEC 17025 accreditation has significantly increased.
Measurement Uncertainty in Food Microbiology
For years, many food microbiology labs have been performing tests and issuing results without estimates of measurement uncertainty.
According to customer surveys and interviews, 88% of participating microbiology labs did not estimate uncertainty because they claimed an auditor or consultant had advised them that it was not required.
Remarkably, this philosophy worked when their microbiology labs received their ISO/IEC 17025 accreditation.
However, each microbiology lab surveyed had been cited during an assessment (within the last 2 years) for not estimating uncertainty.
Confused and frustrated, the majority are wondering why the rules have changed. Furthermore, they want to learn how to estimate uncertainty.
So, what does this mean for you?
Well, if you are a food microbiology lab seeking ISO/IEC 17025 accreditation, you may want to consider the possibility that you will need to calculate uncertainty for your test results.
To help you decide, A2LA has a policy for estimating measurement uncertainty for Life Science Testing Labs. It is a great reference for deciding which test methods require an estimate of uncertainty and which do not.
Additionally, A2LA has published an excellent guide for estimating measurement for microbiology labs. I have used this guide to help several food microbiology labs calculate measurement uncertainty.
In fact, it was the inspiration for this guide!
Uncertainty in Microbiology
In this guide, I am going to teach you 4 ways to calculate measurement uncertainty for microbiological methods.
In addition to the A2LA guide, I have added more detail to help you really understand how to calculate uncertainty. Plus, I have created a Microsoft Excel uncertainty calculator based on all 4 methods which you can download here.
Here is a list of methods that you will learn reading this guide. To jump ahead, just click the link below.
1. Reproducibility Replicates for Laboratory Control Samples
2. Recovery Replicates for Laboratory Control Samples
3. Laboratory Control Samples with Same Target Values
4. Laboratory Method Validation Data
Method 1
Reproducibility Replicates for Laboratory Control Samples
This method estimates the measurement uncertainty for replicate processes or observations by analyzing the same type of sample matrix. The goal is to use reproducibility testing to evaluate how various sources of uncertainty affect routine sampling under different conditions.
Some variables that you can change for reproducibility testing;
- Different Days
- Different Analysts
- Different Equipment
- Different Reagents
More information on this method can be found in ISO TS19036: Microbiology of foods and animal feeding stuffs – Guidelines for the estimation of measurement uncertainty for quantitative determinations.
In the image below, you will see a screenshot of the uncertainty calculator that I created in Microsoft excel to estimate uncertainty using this method.
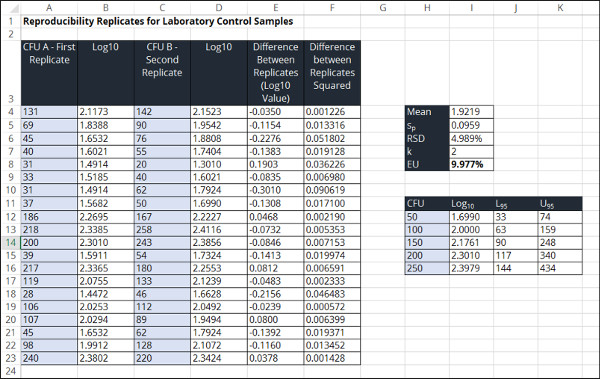
To estimate measurement uncertainty in microbiology using replicates, perform the following steps outlined below.
1. Convert Raw Data to a Log Base 10 Value
In the first step, you will need to convert your raw data to log base 10 values. This is easily accomplish using the following excel function;
=LOG10(Cell1)
Make sure that you convert both your first and second replicate.
2. Calculate the Overall Mean or Average of the Log Base 10 Values
In this step, you will need to calculate the mean (i.e. average) of all the Log Base 10 values that you calculated in step 1. So, make sure to include log base 10 values for both your first and second replicates.
This can be performed in excel using the following function;
=AVERAGE(Cell1:Celln,Cell1:Celln)
3. Calculate the Difference Between Converted Replicates
Next, you will calculate the difference between the Log base 10 values for sets A and B. To do this, just subtract the Log base 10 value of A by the Log base 10 value of B.
=CellA-CellB
4. Calculate the Pooled Standard Deviation
Now, you will need to calculate the pooled standard deviation. This step can be a little complex, so I will break it down for you.
1. Calculate the Sum of Squares for the values calculated in step 3.
2. Divide the result by 2n or 2 multiplied by the number of samples.
3. Calculate the square root of the result.
To make this easier, you can use the following equation in excel;
=SQRT(SUMSQ(Cell1:Celln)/(2*COUNT(Cell1:Celln)))
5. Calculate the Relative Standard Deviation
Now that you have calculated the mean and the pooled standard deviation, your next step will be to calculate the relative standard deviation. This is performed by dividing the standard deviation by the mean.
Your calculated result will be a percentage.
6. Choose a Coverage Factor
Before you calculate expanded uncertainty, you need to choose a coverage factor that will yield you approximately 95% confidence. You can either elect to use a coverage factor of 2 or use the Student’s T Table to find the appropriate coverage factor based on your degrees of freedom.
PRO TIP: If you have 20 or more samples, it is generally acceptable to use a coverage factor of 2. If not, it is recommended that you use the Student’s T Table to find the appropriate coverage factor for your sample size.
7. Calculate the Expanded Relative Uncertainty
Finally, calculate the expanded uncertainty by multiplying your coverage factor (k) and the relative standard deviation.
Method 2
Recovery Replicates for Laboratory Control Samples
This method estimates the measurement uncertainty in microbiology measurements by evaluating recovery over time. The goal is to use recovery differences over time to determine how various sources of uncertainty affect test results.
This method is recommend where recovery is assumed to be reasonably constant for a particular organism in a given matrix.
Some sources of uncertainty that should be analyzed using this method;
- Random Error
- Different Analysts
- Different Equipment
- Different Environmental Conditions
In the image below, you will see a screenshot of the uncertainty calculator that I created in excel to estimate uncertainty using this method.
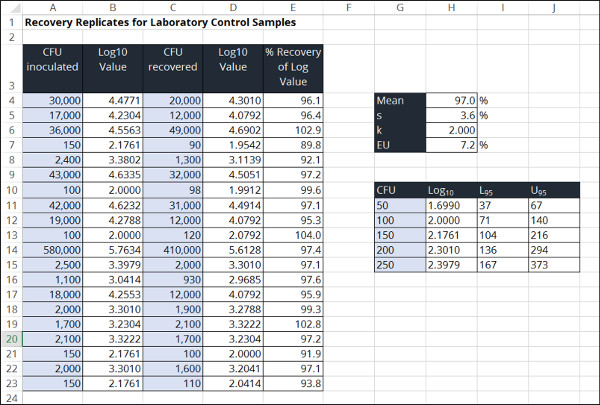
To estimate measurement uncertainty in microbiology using recovery differences, perform the following steps outlined below.
1. Convert CFU Values to Log Base 10 Values.
The first step to calculate uncertainty is to convert your CFU values to log base 10 values. This should been performed for both inoculated and recovered values.
2. Calculate the Percent Recovery of the Log Base 10 Values
After you have converted your CFU values to log base 10, you will need to calculate the percent recovery. This is accomplished by dividing your recovered value by your inoculated value.
3. Calculate the Mean of the Percent Recovery Values
Next, calculate the mean (i.e. average) of your percent recovery values.
4. Calculate the Standard Deviation of the Percent Recovery Values
Additionally, you will calculate the standard deviation of your percent recovery values.
5. Choose a Coverage Factor
Now, you need to choose a coverage factor that will yield you approximately 95% confidence. You can either elect to use a coverage factor of 2 or use the Student’s T Table to find the appropriate coverage factor based on your degrees of freedom.
PRO TIP: If you have 20 or more samples, it is generally acceptable to use a coverage factor of 2. If not, it is recommended that you use the Student’s T Table to find the appropriate coverage factor for your sample size.
6. Calculate the Expanded Uncertainty
Finally, you will calculate your expanded uncertainty. This is accomplished by multiplying your coverage factor and the standard deviation that you calculated in step 4.
Method 3
Laboratory Control Samples with Same Target Values
This method estimates the measurement uncertainty in microbiology test results by evaluating the pooled standard deviation of laboratory control samples. The goal is to determine the intermediate precision of laboratory control samples as method to estimate uncertainty in measurement.
This method is recommend where laboratory control samples have been through all steps of the laboratory’s procedure.
If not, then you should incorporate additional sources of uncertainty into your calculation and use the Root Sum of Squares method to combine them with your calculated pooled standard deviation.

Some sources of uncertainty that you may consider including;
- Sub-sampling
- Aliquoting
- Sample preparation
More information on this method can be found in A2LA P103b Annex: Policy on Estimating Measurement Uncertainty for Life Sciences Testing Laboratories for Category III methods.
In the image below, you will see a screenshot of the uncertainty calculator that I created in excel to estimate uncertainty using this method.
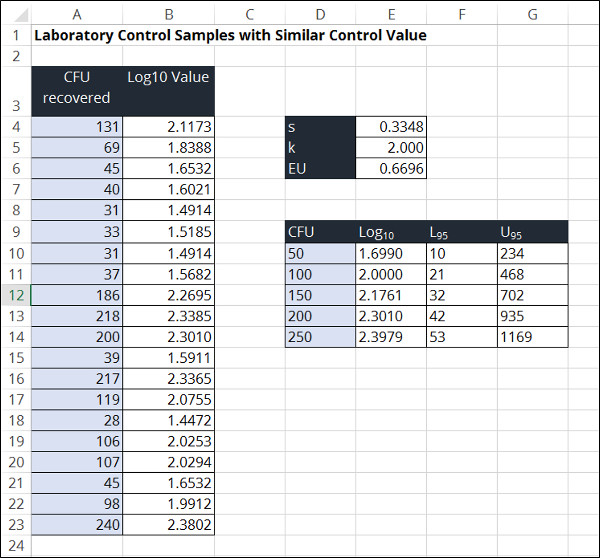
To estimate measurement uncertainty in microbiology using laboratory control samples, perform the following steps outlined below.
1. Convert the CFU values to log base 10 values.
The first step to calculate uncertainty is to convert your CFU values to log base 10 values.
2. Calculate the standard deviation of the log base 10 values.
Next, you will calculate the standard deviation of the log base 10 values.
3. Choose a Coverage Factor
Now, you need to choose a coverage factor that will yield you approximately 95% confidence. You can either elect to use a coverage factor of 2 or use the Student’s T Table to find the appropriate coverage factor based on your degrees of freedom.
PRO TIP: If you have 20 or more samples, it is generally acceptable to use a coverage factor of 2. If not, it is recommended that you use the Student’s T Table to find the appropriate coverage factor for your sample size.
4. Calculate the Expanded Uncertainty
Finally, calculate your expanded uncertainty by multiplying your coverage factor from step 3 and the standard deviation that you calculated in step 2.
Method 4
Laboratory Method Validation Data
This method estimates the measurement uncertainty in microbiology results by using data from an interlaboratory method validation study, internal repeatability testing, and an estimate of bias.
The goal of this method is to estimate uncertainty that is suitable for laboratory use and determine whether you can competently demonstrate the method consistently with the laboratories in the validation study.
This method is recommend for laboratories that have completed or obtained the results of an appropriate validation study that includes all parts of the measurement procedure.
If not, then you should incorporate additional sources of uncertainty (e.g. sub-sampling, sample preparation, etc.) into your calculation and use the Root Sum of Squares method to combine them with your calculated reproducibility.
Additionally, your laboratory must accept that the reproducibility from the validation study will result in an over-estimate of uncertainty.
More information on this method can be found in ISO 21748: Guidance for the use of repeatability, reproducibility, and trueness estimates in measurement uncertainty estimation.
In the image below, you will see a screenshot of the uncertainty calculator that I created in excel to estimate uncertainty using this method.
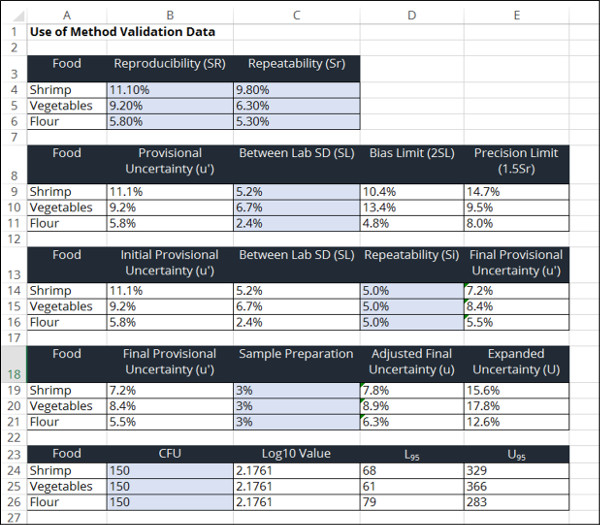
To estimate measurement uncertainty in microbiology using method validation data, perform the following steps outlined below.
1. Determine the Method Validation Repeatability
Determine the repeatability from your method validation study and verify that the results are suitable for your laboratory.
2. Determine the Method Validation Reproducibility
Determine the reproducibility from your method validation study and verify that the results are suitable for your laboratory.
3. Calculate the Between Laboratory Standard Deviation
Once you have determined the repeatability and reproducibility form the validation study, it is time to calculate the Between Laboratory Standard Deviation.
This is accomplished by using the Root Sum of Squares method to combine your repeatability and reproducibility in quadrature. Refer to the equation below for help.

4. Estimate the Laboratory Bias
Now that you know the between laboratory standard deviation, it’s time to estimate your laboratory bias.
This can be accomplished one of the following ways;
- Repeated measurement of reference materials,
- Comparison with a reference laboratory, or
- Proficiency testing
After you have selected a method and collected your data, you will need to use the following equation to calculate your laboratory bias. It is important to know that your laboratory bias should be calculated using converted log base 10 values.

5. Estimate Laboratory Repeatability
Next, you will need to estimate the laboratory repeatability (Si) using an internal study of repeated test results under similar conditions.
To accomplish this, you must collect 20 to 30 repeated samples and calculate the standard deviation from your test results.
6. Calculate the Acceptable Bias Limit
Calculate the acceptable bias limit by multiplying the laboratory standard deviation (from step 3) by 2.

If your laboratory bias is less than the bias limit, then use the laboratory bias.
If your laboratory bias is greater than the bias limit, then your procedure is not fit for use. Therefore, you will need evaluate your method to correct the reason your results are exceeding limits.
7. Calculate the Acceptance Precision Limit
Calculate the precision limit by multiplying your method repeatability by 1.5.

If your laboratory repeatability is less than your precision limit, then the repeatability is acceptable for your method.
If your laboratory repeatability is greater than your precision limit, then you will need to expand your provisional uncertainty using the following equation;

If your laboratory repeatability is much smaller than the repeatability from your method validation study, then may want to reduce your provisional uncertainty using the equation above.
8. Add Additional Uncertainty Influences
In this step, you will want to add any additional components that influence uncertainty that were not included in the validation experiment.
Some influences to consider;
- Subsampling
- Sample preparation
- Reagents
- Environmental Conditions
To add additional uncertainty influences to the provisional uncertainty estimate, use the following equation to calculate your combine standard uncertainty;

9. Choose a Coverage Factor
Now, you need to choose a coverage factor that will yield you approximately 95% confidence. You can either elect to use a coverage factor of 2 or use the Student’s T Table to find the appropriate coverage factor based on your degrees of freedom.
PRO TIP: If you have 20 or more samples, it is generally acceptable to use a coverage factor of 2. If not, it is recommended that you use the Student’s T Table to find the appropriate coverage factor for your sample size.
10. Calculate the Expanded Uncertainty
Finally, calculate your expanded uncertainty by multiplying your coverage factor from step 9 and the combined uncertainty that you calculated in step 8.

Calculating Uncertainty for Subsequent Laboratory Results
Now that you have calculated your expanded uncertainty, you will most likely need to use it to estimate uncertainty for future test results.
To accomplish this, you will need to perform the following steps;
1. Convert your raw data to a Log Base 10 value
Convert your raw data to log base 10 values. This is easily accomplish using the following excel function;
=LOG10(Cell1)
2. Multiply the Log base 10 value by your expanded uncertainty
Next, multiply the log base 10 value calculated in step 1 by your expanded uncertainty.
PRO TIP: Convert your expanded uncertainty to a percentage to make this step easier.
3. Add and subtract this value from your Log base 10 value.
Now, determine the range of uncertainty (i.e. upper and lower boundaries).
First, calculate the upper end of the range by adding the value calculated in step 2 to the log base 10 value calculated in step 1.
Second, calculate the lower end of the range by subtracting the value calculated in step 2 to the log base 10 value calculated in step 1.
4. Calculate the anti-log of each value calculated in step 3.
Now, convert the values calculated in step 3 back to CFU by using the antilog function. To accomplish this, use the number 10 and raise it by the power of the value calculated in step three. Use the equation below as a guide.

5. Round down the value at the lower end and round up the value at the higher end.
Finally, round each value to a whole number. However, there is a catch. You need to round the value at the lower end of the range down to a whole number, and round the value at the upper end of the range up to a whole number.
For example, if the value at the lower end of the range is 79.8, round it down to 79. If the value at the upper end of the range is 248.3, round it up to 249.
To make this entire process easy, I have added this feature to my Microsoft Excel uncertainty calculator so the upper and lower boundaries are automatically calculated. Here are the functions that I used to calculate the upper and lower values in Microsoft Excel:
=ROUNDDOWN(10^(Log10 Value*(1-Expanded Uncertainty)),0)
=ROUNDUP(10^(Log10 Value*(1+Expanded Uncertainty)),0)
More Uncertainty Guides for Microbiology Labs
During my research, I was able to find several measurement uncertainty guides focused on microbiology that I would like to share them with you.
Use the links below to learn more about calculating measurement uncertainty for microbiology labs.
1. Estimating Measurement Uncertainty for Microbiology Procedure by FASC
3. Measurement Uncertainty in Microbiological Testing by Mjikisile Vulindu
4. Estimation of Measurement Uncertainty in Food Microbiology: A Normative Approach by Bertrand Lombard
5. P19 – CALA Measurement Uncertainty Policy by CALA
Conclusion
Calculating measurement uncertainty for microbiological methods has been a challenge for many laboratories seeking accreditation. Do not prevent your laboratory from getting ISO/IEC 17025 accreditation because you have not implemented a process to calculate uncertainty.
Give these 4 methods are try and incorporate the ones that work best for you into your quality management system. If you need some help, try my measurement uncertainty calculator for microbiology laboratories or feel free to contact me at [email protected].




2 Comments