Introduction
Every laboratory needs an uncertainty calculator if they plan to get ISO/IEC 17025:2017 accredited.
According to section 7.6 of the ISO/IEC 17025:2017 standard, every testing and calibration laboratory must evaluate measurement uncertainty and include all contributions considered to be significant.
This means that you need to estimate uncertainty and create uncertainty budgets for all your measurement capabilities.
Now, there are some exemptions to estimating measurement uncertainty. However, only a few types of testing activities qualify to be exempt. If you believe that your activities qualify for exemption, contact your accreditation body to make sure.
For the purposes of this guide, let’s assume that you need to estimate uncertainty. Therefore, you need an uncertainty calculator.
Since ISOBudgets has several uncertainty calculators, this guide will focus only on the Easy Uncertainty Calculator.
In this guide, you will learn how to use the Easy Uncertainty Calculator to:
- Create an uncertainty budget,
- Evaluate your equipment’s calibration data,
- Evaluate your Type A uncertainty data,
- Find your CMC Uncertainty equation (if applicable), and
- Update your Scope of accreditation (if applicable).
If you are ready to get started, continue reading or skip to the section you need to help you use the calculator.
What is the Easy Uncertainty Calculator
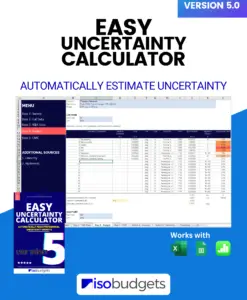
The Easy Uncertainty Calculator is a tool that allows you to easily estimate uncertainty and create uncertainty budgets in Microsoft Excel, Apple Numbers, and Google Sheets.
The best part about the Easy Uncertainty Calculator is that it guides you through my 7 Step Process of Estimating Uncertainty and automates many of the steps so you can create an uncertainty budget faster.
Here is a quick summary of what the uncertainty calculator can help you do:
- Help you setup an uncertainty analysis,
- Analyze your equipment’s calibration results,
- Analyze your Type A uncertainty data,
- Create an uncertainty budget for you, and
- Calculate your CMC Uncertainty (where applicable).
The package includes two versions of the calculator:
- One Budget Calculator, and
- Two Budget Calculator
One Budget Calculator
The one budget calculator is for simple uncertainty analysis with one test-point or a single fixed-point value. You should use this calculator if you:
- Want your uncertainty to be a single value (see image below),
- Need to estimate uncertainty for artifacts or reference standards
Two Budget Calculators
The two budget calculator is for uncertainty analysis at two test-points across a measurement range. You should use this calculator if you:
- Want a CMC Uncertainty equation to estimate uncertainty (see image below),
- Need to estimate uncertainty across a measurement range.
Limitations
The Easy Uncertainty Calculator is great tool for evaluating uncertainty in measurement for most tests and calibrations, but it does have some limitations. It does not work well for complex measurement systems, such as systems with:
- multiple equipment, artifacts, or standards,
- complex equations with multiple input quantities or variables,
If your test or calibration involves a complex measurement system (as described above), then you will want to use the Simple Uncertainty Calculator.
Additionally, you will need your equipment’s last three calibration reports to use the Easy Uncertainty Calculator. If your equipment only has a history of one or two calibrations, then you will need to use the Simple Uncertainty Calculator.
Otherwise, the Easy Uncertainty Calculator is a great tool to have when estimating uncertainty for ISO/IEC 17025.
How to Use the Easy Uncertainty Calculator
This guide will help you use the Easy Uncertainty Calculator to estimate uncertainty for your laboratory’s test or calibration capabilities. Scroll down to read each section or click one the links below to skip to the section you need.
If you have any questions, send an email to: [email protected]
Overview
- Complete the Survey
- Enter your Calibration Data
- Enter your Repeatability and Reproducibility Data
- Customize and Review your Uncertainty Budget
- Find your CMC Uncertainty
- Update your Scope of Accreditation
1. Complete the Survey
Each time you begin an uncertainty analysis, it is best to define the measurement process that you will be evaluating. To do this, you will want to specify the:
- Measurement Function,
- Measurement Method or System,
- Measurement Range, and
- Test Point(s)
The Easy Uncertainty Calculator helps you accomplish this task using a survey. You will find it in the first worksheet of the Microsoft Excel uncertainty calculator.
It asks you to answer five or six questions (depending on the calculator you are using) to help you define the parameters of your measurement process.
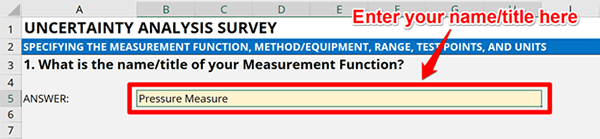
1.1. Add/Enter the Name or Title of your Measurement Function
The first question asks you to name the measurement function that you will be evaluating.
I recommend using a title that matches the measurement function listed in your scope of accreditation. If the measurement function is not currently listed in your scope of accreditation (because it is new and you are adding it to your scope), search your accreditation body’s database for labs with similar measurement functions. See what names and titles they are using and select the one that you would like to use.
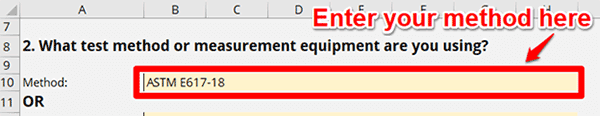
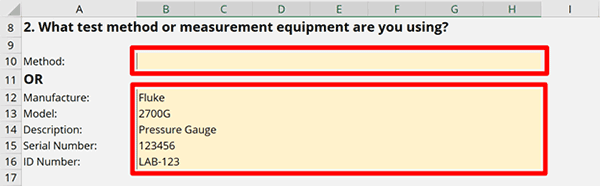
1.2 Add/Enter the Test Method or Measurement System Used
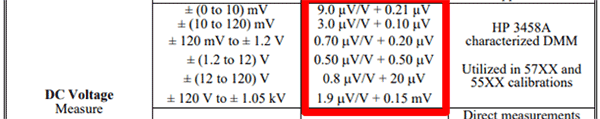
The second question will ask you to describe your test method or measurement system. Simply, list your test method in the method cell or enter the equipment manufacture, model number, description, serial number, and identification number in the associated cells.
If you are a test laboratory, you will most likely list the method that you are performing. Just add the method title or number in the appropriate cell. For example, enter “ASTM E617-18” if you are using the method to perform mass calibration.
If you are a calibration laboratory, you will most likely list the measurement equipment that you are using. Just add the following equipment information:
- Manufacture,
- Model Number,
- Description,
- Serial Number, and
- Identification Number
For example, enter “Fluke; 5522A; Calibrator; 123456; and 123456” if you are using this device as your measurement equipment.
Now, this uncertainty calculator is for simple uncertainty analyses. If you have a more complex measurement system that requires multiple pieces of measurement equipment, then you may want to use the Simple Uncertainty Calculator.
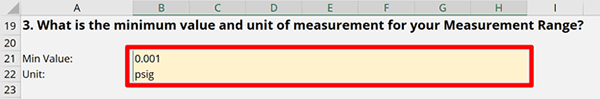
1.3 Enter the Minimum Value of the Measurement Range
The third question asks you to enter the minimum value and unit of your measurement range.
Enter a value that represents the:
- The smallest achievable measurement value,
- The resolution of the test or measurement result, or
- The minimum value published by the manufacturer.
I recommend using the smallest achievable measurement value. Most labs list the minimum value of the measurement range published by the manufacturer. However, these values are not always achievable when you try to source, generate, or measure them.
Assessors know this and will ask you to demonstrate these unachievable values. So, save yourself time and headaches, and make sure to list the smallest value that you can realistically source, generate, or measure.
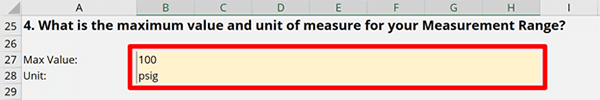
1.4 Enter the Maximum Value of the Measurement Range
The fourth question of the survey asks you to enter the maximum value and unit of your measurement range.
Typically, this is very easy. Enter a value that represents the:
- The maximum achievable measurement value, or
- The maximum value published by the manufacturer.
The easiest way is to look at the manufacturer specifications in manuals or datasheets to find the maximum value of the measurement range.
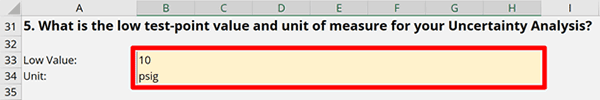
1.5 Enter the Value of the Low Test-Point and Unit of Measurement
The fifth question in the survey asks you to determine the low test-point that you will evaluate in your uncertainty analysis.
I recommend picking a value that is between 10 to 20% of the measurement range. For example, if you have a 0 to 100 psig pressure gauge, select a test point between 10 psi and 20 psi.
Additionally, it is recommended to select a test point that has calibration results associated with it. So, take a look your equipment’s calibration reports and find a test point is calibrated. It will make it easier to estimate uncertainty if you have calibration data to support your evaluation.
After selecting a test point, enter the following information into the calculator:
- The low test-point value, and
- The unit of measurement.
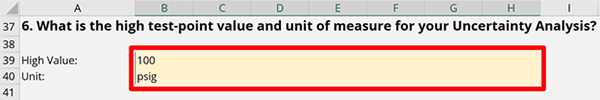
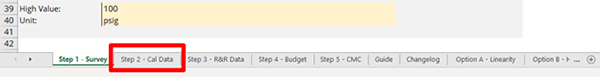
1.6 Enter the Value of the High Test-Point and Unit of Measurement
The sixth question in the survey asks you to determine the high test-point that you will evaluate in your uncertainty analysis.
I recommend picking a value that is between 90 to 100% of the measurement range. For example, if you have a 0 to 100 psig pressure gauge, select a test point between 90 psi and 100 psi.
Additionally, it is recommended to select a test point that has calibration results associated with it. So, take a look your equipment’s calibration reports and find a test point is calibrated. It will make it easier to estimate uncertainty if you have calibration data to support your evaluation.
After selecting a test point, enter the following information into the calculator:
- The high test-point value, and
- The unit of measurement.
Proceeding to the Next Step
After completing the survey, click the “Step 2 – Cal Data” tab at the bottom of the spreadsheet. It will take you to the next worksheet where you will enter your equipment’s calibration results.
2. Enter your Equipment Calibration Data
In this section of the uncertainty calculator, you will enter your equipment’s calibration results to evaluate the random and systematic uncertainties associated with your measurement equipment.
To complete this section, you will need to collect the last three calibration reports for your measurement equipment.
If you have less than 3 calibration reports, this may cause a problem. The calculator is designed to evaluate the results of three calibration events. Entering less data can cause errors in the analysis.
However, the calculator can be modified to evaluate less information. Contact me if you need the uncertainty calculator modified.
2.1 Enter Measurement Equipment Information
When you go to the “Step 2 – Cal Data” tab, you will notice that some of the information is prepopulated for you so you do not have to enter your information twice. Just make sure to verify that the information is correct.
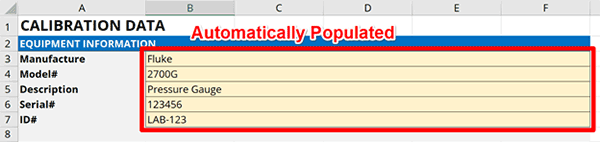
If you entered a method in Step 1 instead of equipment, you will see that these cells are blank. Enter the following information into the form:
- Manufacture Name,
- Equipment Model Number,
- Equipment Description,
- Equipment Serial Number, and
- Equipment Identification Number.
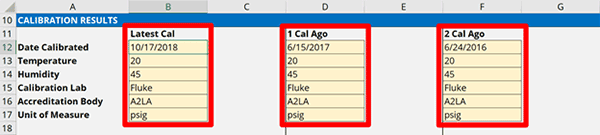
2.2 Enter Equipment Calibration Information
Looking at your calibration reports and enter the following information into the uncertainty calculator:
- The calibration date,
- The calibration temperature,
- The calibration humidity (if available),
- The name of the calibration lab,
- The name of the lab’s accreditation body, and
- The unit of measurement (if applicable).
Entering the calibration date is important because it will be used to calculate drift. The rest of the information is optional, but I recommend that you add it for informational purposes.
It is good practice to evaluate the following information:
Environmental Conditions
It is a good idea to pay attention to the environmental conditions that your equipment is calibrated in. If your equipment is sensitive to temperature, then it may be important to evaluate the temperature that your equipment is calibrated at. Especially, if the calibration temperature is different than the temperature your equipment is used at.
It could significantly affect your measurement results.
Calibration Lab
You should pay attention to the labs that are calibrating your equipment. If you are using different laboratories, check to see if their results are consistent. Also, pay attention to the calibration uncertainty being reported in their certificates. Their reported uncertainty will affect your uncertainty analysis.
So, you should make sure that you select laboratories that:
- Are ISO/IEC 17025 accredited (if available or applicable),
- Provide uncertainties consistent with your laboratory’s requirements.
Accreditation Body
Checking the accreditation body is a good way to ensure that the laboratory and(or) the results are accredited. However, this is not a guarantee since labs can report non-accredited results in an accredited certificate.
Nonetheless, it is good practice to make sure that accredited laboratories are calibrating your equipment and that the results have metrological traceability.
Additionally, you should make sure that the accreditation body is a signatory to the ILAC MRA. This is important for mutual recognition and acceptance.
From a macro level, this is good information to look at when performing an uncertainty analysis. It can help you make decisions when getting your equipment calibrated in the future. Look at the image below to see this section included in the uncertainty calculator.
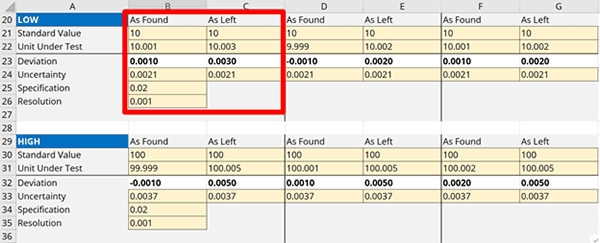
2.3 Enter Equipment Calibration Results
Now, you need to enter your equipment’s calibration results into the calculator.
You will notice that there is room to enter the results for three calibrations. The result should be entered left to right with the most recent results on the left and the older results to the right.
To enter your calibration results:
- Look at your most recent calibration report,
- Find the results associated with the low test-point that you selected,
- Enter the Nominal Value or Standard Value for both As Found and As Left into the calculator where it asks for Standard Value.
- Enter the Calibration Results for both As Found and As Left into the calculator where it asks for Unit Under Test.
- Enter the reported measurement uncertainty into the calculator where it asks for Uncertainty.
- (Optional) Enter the specification or tolerance limit into the calculator where it asks for Specification.
- Enter the Resolution of your equipment into the calculator where it asks for Resolution.
- Repeat steps 1 through 8 for the high test-point that you selected,
- Repeat steps 1 through 9 for the two previous calibration reports.
2.4 Uncertainty Analysis Results
After you have entered your calibration results, you will notice the following information in the calculator.
You do not need to do anything. It is automatically calculated for you.
This section will automatically evaluate the following sources of uncertainty:
- Stability (STB),
- Bias (BIA),
- Drift (DFT),
- Resolution (RES),
- Reference Standard Uncertainty (REF), and
- Reference Standard Stability (RFS).
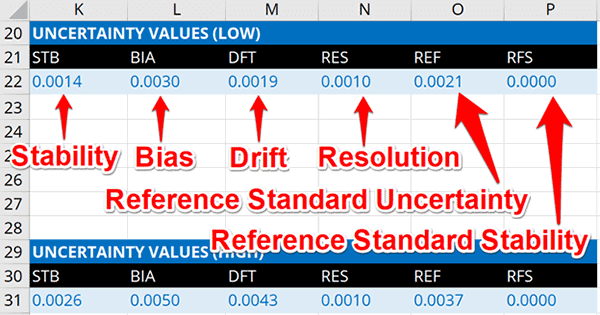
Review the results to make sure that you do not see errors or erroneous results. If you do, double-check the information that you input into the calculator and make sure that there are no mistakes.
These results will be automatically added to your uncertainty budget, so you do not need to write them down or copy and paste them into your budget.
Proceeding to the Next Step
Click on the next tab, Step 3 – R&R Data, to enter your Repeatability and Reproducibility (i.e. Type A uncertainty) data.
![]()
3. Enter your Repeatability & Reproducibility Data
Next, you need to enter your Type A uncertainty data. Typically, this is data collected from repeatability and reproducibility studies.
If you are not sure how to perform repeatability and reproducibility testing, here are some guides that will help you:
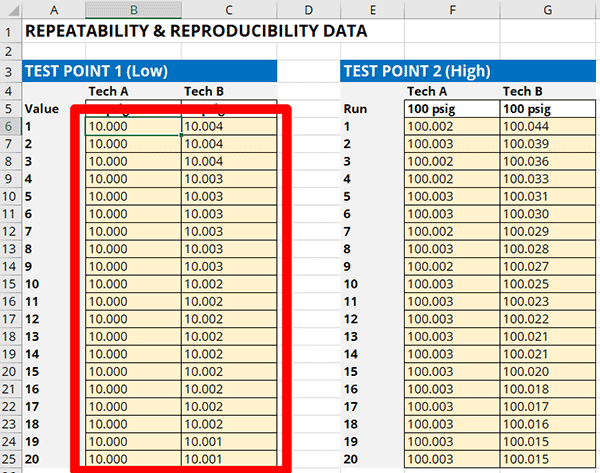
3.1 Enter Repeatability and Reproducibility Results
After performing a repeatability and reproducibility test, enter your results in the calculator as shown in the image below.
If you using the two uncertainty budget calculator, enter your results for the low test-point in the columns on the left. Then, enter your results for the high test-point in the columns on the right.
3.2 Review Type A Uncertainty Results
Once you entered all of your repeatability and reproducibility test data, scroll down the spreadsheet to see the ANOVA section. ANOVA is the acronym for Analysis of Variance.
ANOVA – Analysis of Variance
In this section your will see descriptive statistics from your data sets. Here is a list of what is evaluated:
- MEAN – Mean or Average
- STDEV – Standard Deviation
- DOF – Degrees of Freedom
- SS – Weighted Variance
- ESS – Sum/Total Weighted Variance
- EDOF – Sum/Total Degrees of Freedom
RESULTS
Below ANOVA, you will see the Results section. In this section, you will see your repeatability and reproducibility testing results.
- RPT – Repeatability
- RPD – Reproducibility
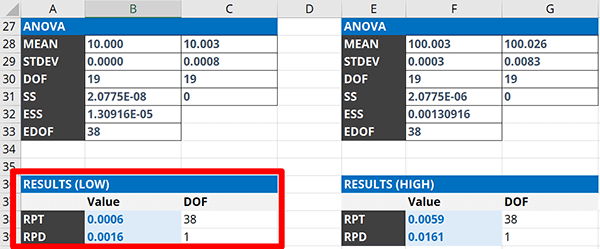
Review the results to make sure they are appropriate for your uncertainty analysis and make sure that the results you entered do not contain any errors. If not, you have completed the Repeatability and Reproducibility section.
These results will be automatically added to your uncertainty budget, so you do not need to write them down or copy and paste them your budget.
Proceeding to the Next Step
Click on the next tab, Step 4 – Budget, to review your uncertainty budget and added additional significant contributors.
![]()
4. Review and Customize your Uncertainty Budget
Now, it is time to review and customize your uncertainty budget.
There are a lot of things that the Easy Uncertainty Calculator automates for you, but there are still other important processes in this section that you will need to do manually.
Here is a list of the processes covered in this section:
- Verify the information is correct,
- Add any additional significant contributors,
- Select the Uncertainty Type,
- Select the Probability Distribution,
- Add the degrees of freedom,
- Select your Coverage Factor,
- Review the Expanded Uncertainty,
- Add notes to support your Uncertainty Analysis
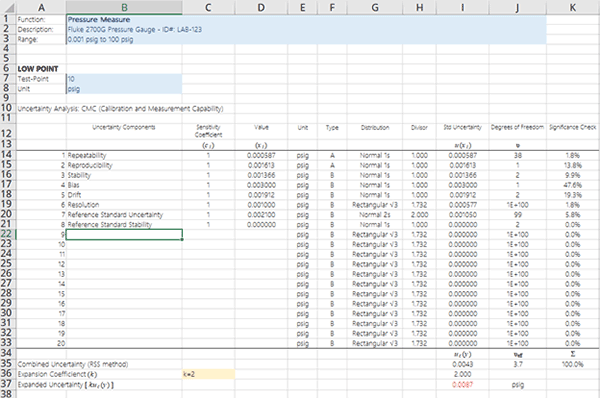
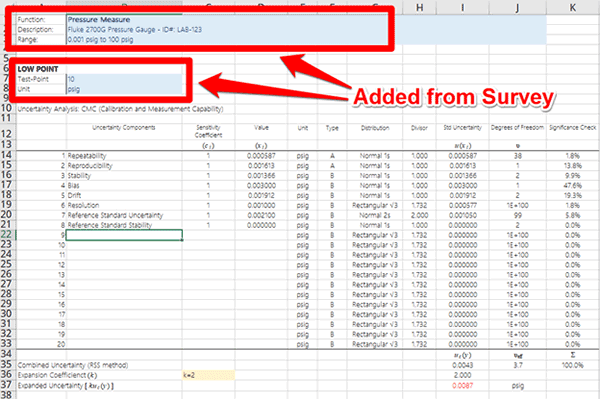
4.1. Verify the Information is Correct
First, you need to verify that all of the information that you entered is correct. Next, make sure that all of the automated information is correct. If not, you will need to correct it.
Take a look at the following information and make sure that it is correct.
- Function,
- Description,
- Range,
- Test-Point, and
- Unit
If the information shown is not correct, go to ‘STEP 1 – Survey’ to correct it or manually enter the correct information.
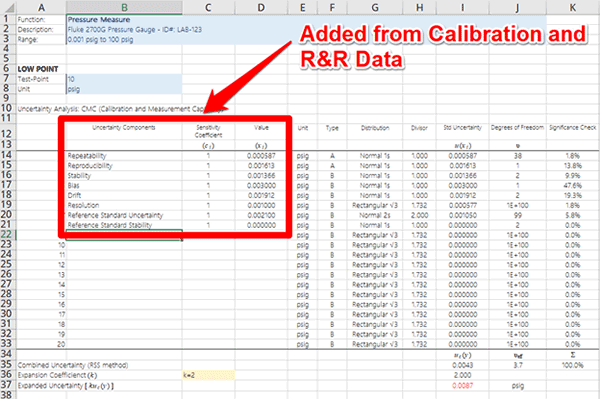
Next, take a look at the following information and make sure that it is correct.
- Uncertainty Components,
- Sensitivity Coefficient,
- Value, and
- Unit
If the information shown is not correct, go to ‘STEP 2 – Cal Data’ and(or) ‘STEP 3 – R&R Data’ to correct it or manually enter the correct information.
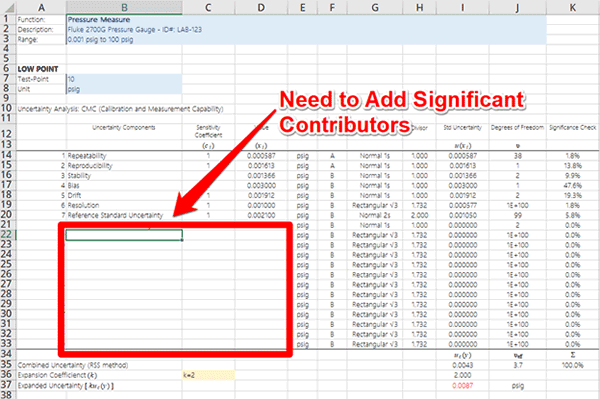
4.2 Add Any Additional Significant Contributors
After verifying that all the automatically populated data is correct, add any additional significant contributors that influence the uncertainty of your measurement results in the area shown below.
Consider adding additional contributors related to the:
- Environment (e.g. temperature),
- Equipment,
- Method/Process, and(or)
- Unit Under Test.
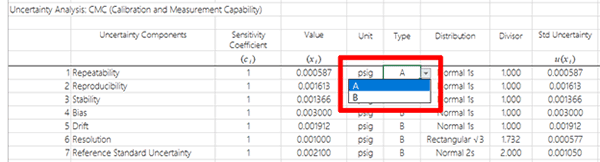
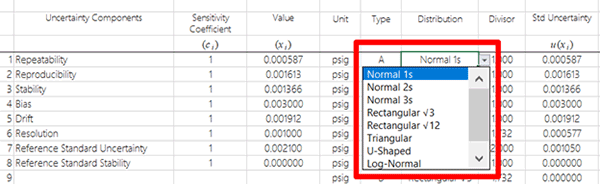
4.3 Select the Uncertainty Type
Now that all of your sources of uncertainty are listed, it is time to characterizing them. The first step to characterization is to determine whether they are:
- Type A Uncertainty, or
- Type B Uncertainty
Once you pick the uncertainty type, click on the dropdown menu, and select the type associated with your uncertainty component. Then, repeat the process until you have assigned an uncertainty type to each contributor.
4.4 Select the Probability Distribution
The second step to characterizing sources of uncertainty is determine their probability distribution.
You have a lot of options to pick from, but most people typically use Normal and Rectangular distributions.
If you are not sure what to pick, take a look at the table below:
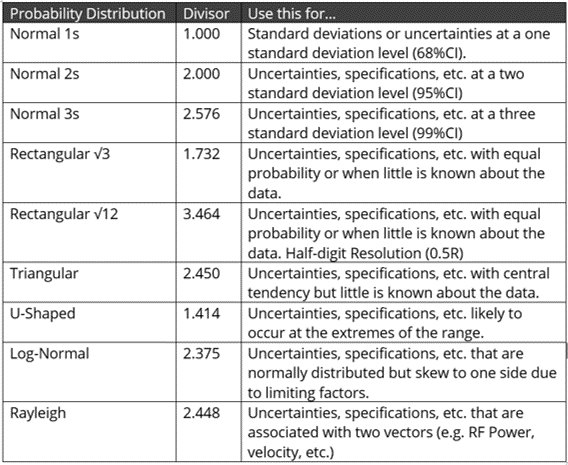
Once you decide on the probability distribution, click on the dropdown menu, and select the probability distribution associated with your uncertainty component. Then, repeat the process until you have assigned a probability distribution to each contributor.
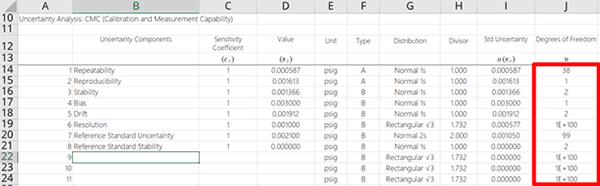
4.5 Add the degrees of freedom
Adding degrees of freedom to your uncertainty budget can be valuable, but only if you determine your coverage factor (k) using the Student’s T Table.
Therefore, this can be optional since it may not benefit your uncertainty analysis.
Nonetheless, it is a good practice to include this information in your uncertainty budgets, so I recommend doing it.
Here is what you need to do (based on the probability distribution you selected):
Rectangular Distributions
If your uncertainty contributor has a Rectangular distribution, use a number that represents infinity. I prefer to use a googol (1E+100). However, feel free to use any number you like as long as it is an exceptionally large number compared to your other contributors.
Normal Distribution (Evaluating your own data)
If your uncertainty contributor has a Normal distribution where you evaluated your own data, calculate the degrees of freedom by counting the number samples evaluated and subtracting it by one (i.e. v = n – 1). For example, if you collect and evaluate 50 samples, your degrees of freedom would be 49 (i.e. 50 – 1 = 49).
Normal Distribution (Evaluating other peoples’ data)
If your uncertainty contributor has a Normal distribution where you used specifications or other data (that you did not evaluate), use a reasonably large number that represents your confidence in the data. I prefer to use 99 degrees of freedom assuming that the information was evaluated by another party using a reasonably large set of data. Feel free to use any number you like as long as it is reasonably large but does not match or exceed the value you selected for infinity.
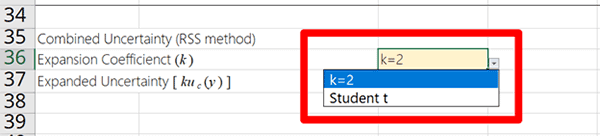
4.6 Select your Coverage Factor
Now, it is time to select your coverage factor. Do you want use:
- k=2, or
- Student’s T Table.
Just use the dropdown menu shown in the image below to select which coverage factor you would like to use.
The goal is to find a coverage factor that yields an approximately 95% confidence interval. However, the method used to determine the coverage factor (k) is different.
Here is what I recommend for you:
k=2 (Most Common)
If your uncertainty analysis includes a combination of Type A and Type B uncertainty contributors, then you most likely want to use the k=2 method.
It is the easiest and most common method of selecting a coverage factor.
Student’s T Table
If your uncertainty analysis includes mostly Type A uncertainty data or prefer using the Bayesian Statistics approach, then you most likely want to use the Student’s T Table method.
This method will determine a coverage factor (value for k) from the Student’s T Table based on your desired coverage probability (i.e. 95.45%) and the number of degrees of freedom.
This method is not as common as k=2, so verify that this is the approach that you would like to use.
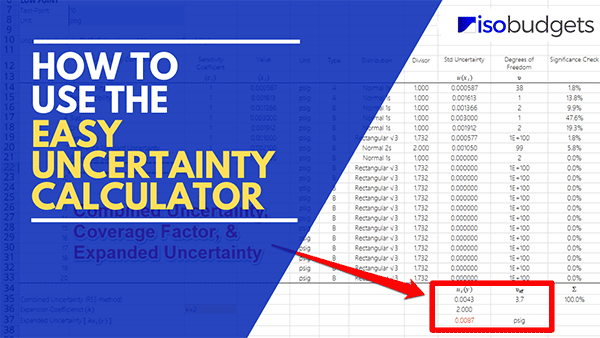
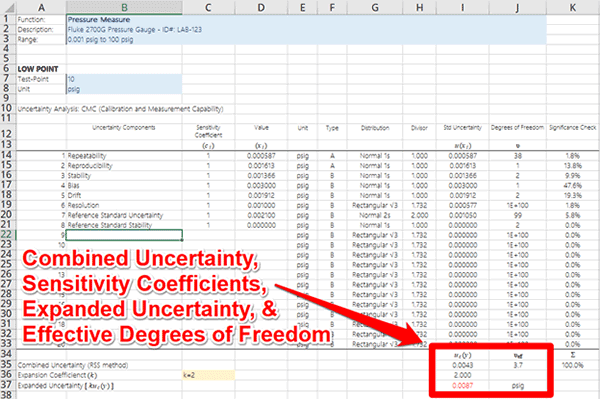
4.7 Review the Expanded Uncertainty
By now, the Easy Uncertainty Calculator should have automatically estimated the expanded uncertainty. However, you need to review your results and verify that the expanded uncertainty is appropriate for use.
Verify that the expanded uncertainty is:
- Free of mistakes or errors,
- Not overstated (i.e. too large) or understated (i.e. too small),
- Larger than the Reference Standard Uncertainty,
- Rounded to two-significant figures, and
- Comparable to other labs with similar functions and systems,
Overall, you want to make sure that your expanded uncertainty is reasonable and appropriate for your test or measurement capabilities.
From the results of your evaluation:
- If it is reasonable and appropriate, then use it.
- If it is not reasonable and appropriate, then reevaluate the uncertainty analysis.
If you need more help evaluating your expanded uncertainty, read section 8 of this guide.
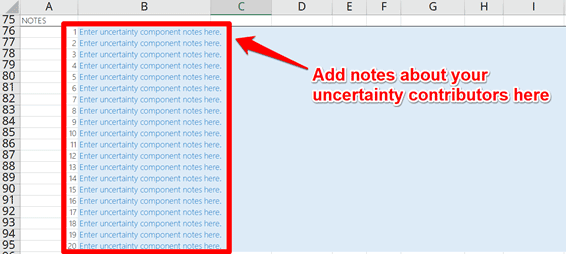
4.8 Add Notes to Support Your Uncertainty Analysis
You should add notes to every uncertainty budget. It is a critical step that most people do not include in their uncertainty analysis.
However, most people regret not adding notes when:
- An assessor asks questions about the uncertainty analysis,
- The lab needs to update the uncertainty budget.
The most common questions that I hear are:
- How was this value calculated?
- Where did this data come from?
- Is this contributor significant?
To prevent yourself from asking the same questions later on, make sure to add notes to your uncertainty budgets. There is section just below the budget table for adding notes.
Try to include information that answers the three questions above. It will save you time and prevent headaches in the future.
Proceeding to the Next Step
If you re using the Two-Budget version of the Easy Uncertainty Calculator, then click on the next tab, Step 5 – CMC, to find your CMC Uncertainty equation for your scope of accreditation.
![]()
5. Find your CMC Uncertainty
In this section of the Easy Uncertainty Calculator, you will be able to use the CMC Uncertainty Calculator to:
- See how your expanded uncertainty is analyzed,
- See the typical CMC Uncertainty equation template,
- Find your CMC Uncertainty Coefficients,
- See options to help you write your CMC Uncertainty equation,
- Verify your CMC Uncertainty coefficients, and
- Predict uncertainty for common values of your measurement function.
This is a lot of information to cover, but I promise that the process is easier than you think.
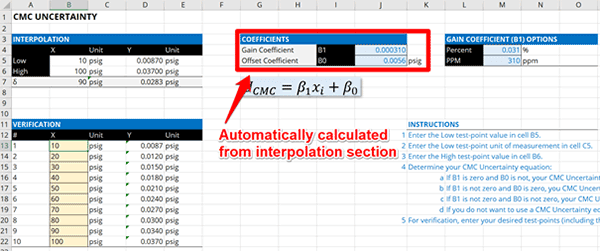
Look at the image below to see what the CMC Uncertainty Calculator looks like.
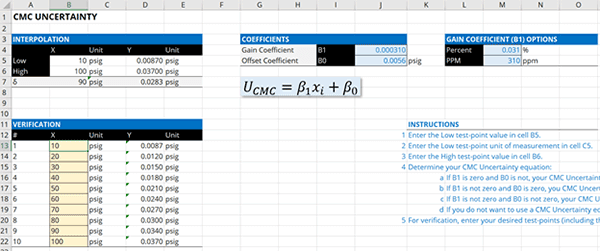
5.1 Interpolation of Results
The first part of the CMC Uncertainty calculator that you want to pay attention to is the section labeled ‘Interpolation.’
This part of the calculator will analyze the expanded uncertainty from your low and high test-points using interpolation to calculate the coefficients needed for your CMC Uncertainty equation.
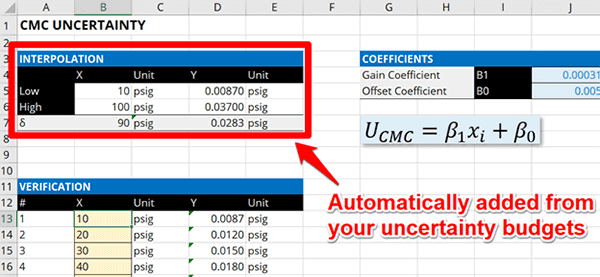
You do not need to do anything here. The results are automatically populated from the values estimated by your uncertainty budgets.
5.2 CMC Uncertainty Coefficients
The second place that you want to look is the section labeled ‘Coefficients.’ These are the regression coefficients that will become part of your CMC Uncertainty equation.
Looking at this block of information, you will notice two coefficients;
- Gain Coefficient
- Offset Coefficient
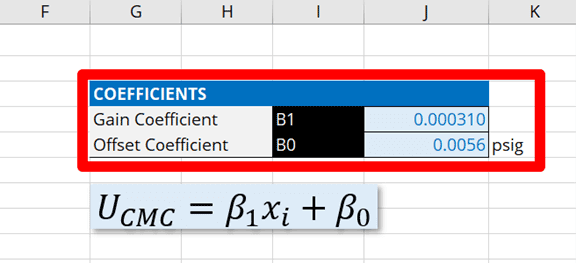
Gain Coefficient
The gain coefficient is the coefficient that controls the slope or gain. Some companies refer to it as a ‘Multiplier’ because you multiply it by your measurement result or nominal value to calculate your measurement uncertainty.
Offset Coefficient
The offset coefficient is the coefficient that controls the zero offset or y-intercept. Some companies refer to it as an ‘Adder’ because you add it to your estimated uncertainty. Others refer to it as a ‘Floor’ value.
You do not need to enter any information here because it is automatically populated by the results of the Interpolation section.
5.3 CMC Uncertainty Equation
Now that you know about gain and offset coefficients, you can write out your CMC Uncertainty equation so you can add it to your scope of accreditation.
Look at the image below, you will notice an equation. This is the equation for calculating your CMC Uncertainty. Additionally, you will notice the coefficients:
- B1 (i.e. Beta-one)
- B0 (i.e. Beta-naught)
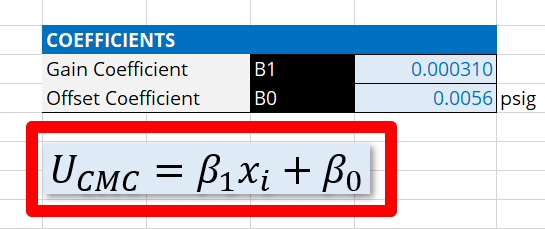
You will want to replace the symbols in the equation with coefficients from the Coefficients section. However, you have options to make the equation easier to interpret and use.
In the image below, you will notice the section names ‘Gain Coefficient (B1) Options.’ These are options that you can use to help you write out your equation.
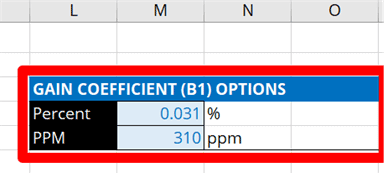
Instead of using the value of the coefficient, you may prefer to convert it to a percentage (%) or a part-per-million (ppm) value. Using this technique can help you simplify your equation and make it consistent with how other labs write their equation in their scope of accreditation.
However, you cannot use part-per-million (ppm) in your scope of accreditation. Instead, you must substitute ‘ppm’ with unit-per-unit. For example, you may see this listed as:
- µV/V,
- µin/in,
- µpsi/psi,
- µg/g
So, make sure that you are aware of this when writing out your equation.

5.4 Verification and Uncertainty Prediction
Before adding your CMC Uncertainty equation to your scope of accreditation or using it to estimate uncertainty, you need to verify that it calculates the correct values. This is where the ‘Verification’ table becomes useful.
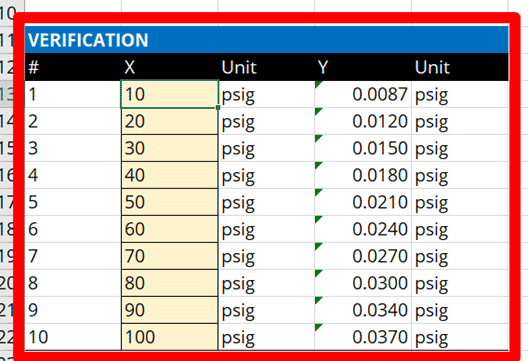
You can use it to:
- verify that your CMC equation is accurate, and
- predict uncertainty for other values or results.
It can be a very helpful tool to have. Plus, it is always good practice to verify your results.
If you want to verify or check the uncertainty for values not listed in the table, then simply update the value in the ‘X’ column with the yellow-colored cells.
Make sure that you enter values into the calculator that are in between the values that you estimated uncertainty for (i.e. low and high test-points). If not, you may encounter incorrect results due to extrapolation.
6. Add your CMC Uncertainty to your Scope of Accreditation
After you have completed all the work for estimating measurement uncertainty, it is time to update your scope of accreditation.
This is a fairly simple process. However, it can get complicated.
6.1 Review the Policies and Guides
Each accreditation body has their own rules and guidance on how to draft your scope of accreditation. So, make sure that you read and follow your accreditation body’s rules.
Below, I have provided you a list of links to help you find the right guidance documents for your accreditation body.
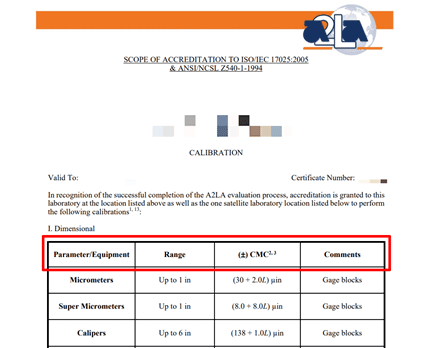
A2LA
- A2LA G118 – Guidance for Defining the Scope of Accreditation for Calibration Laboratories
- A2LA F112 – Request for Expansion of Scope of Accreditation – Calibration
- A2LA F108 – Request for Expansion of Scope of Accreditation – Testing
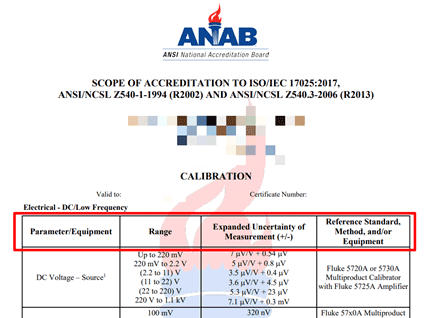
ANAB
- PR 2350, Preparing a Draft Scope of Accreditation for ISO/IEC 17025 Testing Laboratories
- PR 2351, Preparing a Draft Scope of Accreditation for ISO/IEC 17025 Calibration Laboratories
- PR 2360, Preparing a Draft Scope of Accreditation for ISO/IEC 17025 Dimensional Measurement Laboratories
PJLA
- PJLA PL-4 – Policy on Calibration Scopes of Accreditation
- PJLA WI-8 – Work Instructions for Setting Up Scope of Accreditation Testing
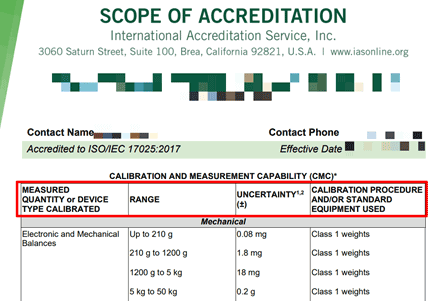
IAS
- IAS Guide for Representing Scope of Accreditation for Calibration Labs
- IAS Policy on the Expansion of the Scope of Accreditation of Accredited Testing Laboratories and Inspection Laboratories
NVLAP
6.2 Updating Your Scope of Accreditation
To update your scope of accreditation, you need to have your accreditation body send you a draft copy of your scope.
This document is typically an editable Microsoft Word document that will allow you to add or change your list of measurement capabilities. Looking at the document, you will notice that you have four columns that need to updated.
Now, the names of these columns vary depending on the accreditation body. However, the process is still the same.
6.2.1 Update the Measurement Function
This is the first column from the left. Here, you will want to list one of the following:
- Name of the Measurement Function,
- Name of the Equipment that will be tested or calibrated, or
- Name of the Method
6.2.2 Update the Measurement Range or Value
In the second column from the left, you will want to list the:
- Measurement range and units of measurement, or
- Measurement or reference standard value with unit of measurement.
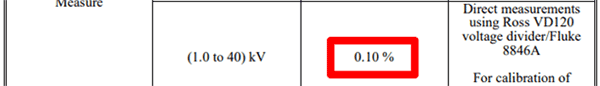
6.2.3 Update the CMC Uncertainty
In the third column, you will need to list your CMC Uncertainty in one of the following formats;
- Single value with unit of measurement,
- Equation with units of measurement,
- Matrix or Table with units of measurement, or
- Graph (not common)
6.2.4 Update the Comments, Equipment, or Method
In the fourth column, you will list one of the following:
- Method,
- Reference Standard, or
- Equipment,
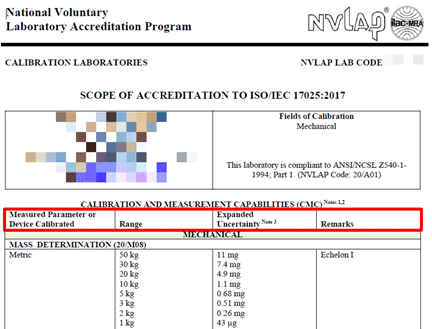
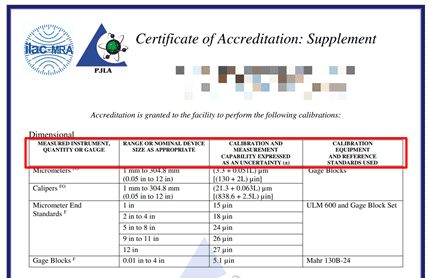
Take a look at the images below to see scope of accreditation examples from each accreditation body in the US (that is part of the ILAC-MRA).
A2LA
ANAB
IAS
NVLAP
PJLA
6.3 Requesting a Scope Expansion
Now that you know the policies and guidance related to scopes of accreditation, it is time to update your scope of accreditation.
Perform the following steps to update your scope of accreditation:
- Contact your Accreditation Body,
- Request a Scope Expansion Form,
- Request a draft copy of your Scope of Accreditation,
- Open or Print the Scope Expansion Form,
- Complete the Form,
- Save or Scan the Form,
- Open or Print the Draft Scope of Accreditation,
- Add or Update the following information:
- Measurement Function/Parameter/Discipline,
- Measurement Range,
- CMC Uncertainty, and
- Notes/Comments/Remarks/Method/etc.
- Verify the information is correct,
- Save the file,
- Submit to the following to your accreditation body:
- Scope expansion form,
- Draft scope of accreditation, and
- Any associated uncertainty budgets.
After submitting your request, give your accreditation body time to approve the changes. They typically need to send it to an assessor for review and approval. Then, it will go to the accreditation council for final approval.
Once approved, your new scope of accreditation will be updated and published in the accreditation body’s database for public viewing.
Conclusion
Estimating uncertainty in measurement can be difficult. However, the Easy Uncertainty Calculator makes the process much easier to complete even for beginners to estimating uncertainty.
In this guide, you should have learned how to use the Easy Uncertainty Calculator step-by-step. Although this guide is not short, the intention was to make sure to include a lot of detailed information to answer some of the most common questions users ask. Plus, I wanted to make sure to breakdown the process into easy steps with plenty of explanation so you to know exactly what actions you should take next.
Hopefully, this guide answers all your questions. If not, make sure to leave a comment below. Your feedback will help make improvements to this guide.