Introduction
Estimating uncertainty in measurement for chemistry laboratories is quite different compared to other types of laboratories. Most chemistry labs need to use two different processes to estimate uncertainty.
Typically, there is one process to evaluate uncertainty for physical measurements and another process for analytical chemistry measurements. Although each uncertainty analysis uses the GUM method, the process needed to estimate uncertainty is quite different.
When you evaluate uncertainty for physical measurements (e.g. mass, volume, temperature, pH, etc.), the process is similar to the methods used by other types of laboratories. Additionally, there are plenty of guides and resources available to help with uncertainty analysis.
However, when you estimate uncertainty for analytical measurements, the process is not same. There is a multi-step process that needs to be evaluated from beginning to end.
The problem for chemical labs is the availability of guides and resources is limited which can make estimating uncertainty difficult. This creates a gap in the market that leaves many chemical laboratories without a solution or examples to estimate uncertainty.
Therefore, I have created a guide to help chemical laboratories estimate uncertainty in measurement for their analytical processes. The information in this guide is especially helpful for labs that use HPLC’s, GC’s, MS’s, and similar devices to test samples.
In this guide, you will learn the following information to help you calculate uncertainty for analytical measurements.
- What is Measurement Uncertainty
- Why is Measurement Uncertainty Important
- What are the Best Uncertainty Guides for Chemical Labs
- How to Estimate Uncertainty for Chemistry Labs
Click here to download the chemical measurement uncertainty calculator for free!
What is Measurement Uncertainty
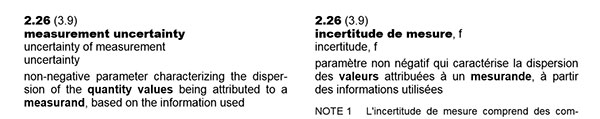
According to the Vocabulary in International Metrology (VIM), measurement uncertainty is a non-negative parameter characterizing the dispersion of the quantity values being attributed to a measurand, based on the information use.
Essentially, measurement uncertainty is an estimated range of values that your measurement result could confidently be within.
Since measurements are actually estimated values based on a systematic process, it is appropriate to estimate the uncertainty associated with the measurement.
Why is Measurement Uncertainty Important
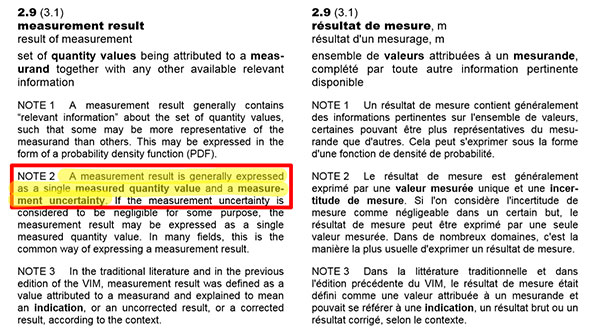
Measurement uncertainty is important. It is just as important as the measurement result that is recorded in your test reports. In fact, the GUM and the VIM both state that a complete measurement result contains a single measured quantity value and the measurement uncertainty.
Therefore, your measurement results are not complete when an estimate of measurement uncertainty is not given.
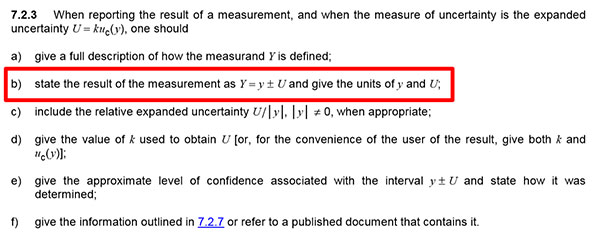
Take a look at the excerpt below from the Guide to the Expression of Uncertainty in Measurement (GUM). The guide states that you should report your results with an estimate of measurement uncertainty and give the units of measurement.
Best Uncertainty Guides for Chemistry Labs
When estimating measurement uncertainty for chemistry labs, there are a few guides available that you should know about.
- JCGM 100:2008
- Eurachem/CITAC CG4: QUAM:2012 Part 1
- SAC/Singlas Technical Guide 2
JCGM 100:2008: Guide to the Expression of Uncertainty in Measurement
First, you need to know about the Guide to the Expression of Uncertainty in Measurement, also known as the GUM. It is identified as the JCGM 100:2008 and is available from the BIPM website.
This is the most referenced and used guide for measurement uncertainty. Additionally, it is the guide that influences most of the requirements for ISO/IEC 17025:2017 accreditation. So, you should make sure that you download a copy, save it to your computer, and read it.
Click here to download the guide.
EURACHEM/CITAC: Quantifying Uncertainty in Analytical Measurement
Next is the most referenced measurement uncertainty guide for chemical laboratories, the EURACHEM/CITAC QUAM.
This is a great guide that is easy to read, has a great outlined process (similar to this guide), and has plenty of examples to help you estimate uncertainty.
The downside is this guide does not have examples for estimating measurement uncertainty when using HPLC’s, GC’s, or MS’s which causes a large gap for many accredited laboratories. This is very unfortunate, and I hope that examples are added in the next edition.
Click here to download the guide.
SAC/SINGLAS Technical Guide 2: Guide on Measurement Uncertainty in Chemical & Microbiological Measurement
This guide is published by the Singapore Accreditation Council and is not as well known. However, it is a great guide that fills in some the gaps in information left of the EURACHEM guide.
The guide has great examples and include an example of estimating uncertainty for a GC, but could still use more examples. Also, the process for estimating uncertainty is not as defined as the EURACHEM guide. However, it is a great secondary guide that I believe you should add to you reference library.
Click here to download the guide.
EURACHEM/CITAC: Measurement Uncertainty Arising From Sampling Guide
This is another guide provided by EURACHEM that covers measurement uncertainty in sampling. It is not a commonly used guide, but it is an excellent guide.
If you perform sampling, I recommend that you download and use it. It lacks a formal process for estimating uncertainty. However, it covers sources of uncertainty related to sampling, experiment designs for quantifying uncertainty, and examples of statistical techniques used to analyze data which I find incredibly valuable.
Click here to download the guide.
How to Estimate Uncertainty in Chemistry
Estimating measurement uncertainty for chemical testing laboratories is typically different compared to other types of laboratories. Especially for analytical measurements. There are extra steps that need to be taken and additional processes that need to be evaluated.
To help you out, I have outlined an 8 step process that will assist you in estimating measurement uncertainty. Each step of the process is important and I have included plenty of helpful information to guide you through the process.
The 8 steps that will be covered in section are:
- Specify the Measurand
- Identify Sources of Uncertainty
- Quantify Sources of Uncertainty
- Characterize Sources of Uncertainty
- Convert Uncertainties to Standard Deviations
- Calculate the Combined Uncertainty
- Calculate the Expanded Uncertainty
- Evaluate Your Uncertainty Budget
Step 1: Specify the Measurand
The first thing that you should do every time you estimate uncertainty is to specify the measurand. This will help you frame your uncertainty analysis and focus your attention on what matters most.
How to Specify the Measurand
To specify the measurement function, follow the instructions below:
- Select the test or measurement function to evaluate.
- Select the measurement method or procedure to be used.
- Select the equipment that will be used.
- Select the desired range of the measurement function.
- Determine the target values to be evaluated.
- Where applicable, identify the mathematical equation that characterizes the measurement function.
Need More Help
If you are having trouble with this process, try answering the following questions:
- What am I measuring?
- What method will I use?
- What equipment and materials do I need?
- What is the range (e.g. low and high) of my measurement capability?
- What is my target sample concentration?
Afterward, record the information and add it to your uncertainty budget similar to the image below.
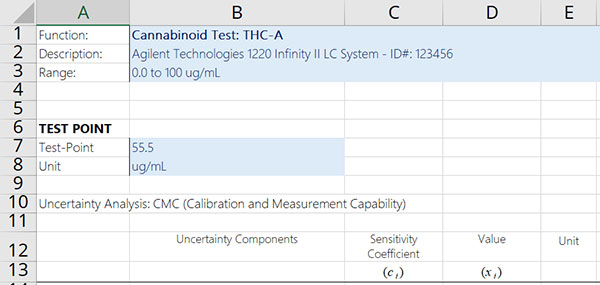
Now that you have identified the criteria for your evaluation of measurement uncertainty, you will have a much easier time completing the remaining steps of the process.
Step 2: Find Sources of Uncertainty
Finding sources of uncertainty in chemical analysis is different compared to the typical uncertainty analysis for physical measurements. However, you still want to focus on the process and the equations involved in each step.
When evaluating measurement uncertainty in chemical analysis, focus on the analytical measurement process:
- Sampling
- Sample Preparation
- Standard Preparation
- Equipment Calibration
- Sample Analysis
- Interpretation of Results
How to Find Sources of Uncertainty
To find sources of uncertainty for chemical analysis, follow steps listed below:
- Evaluate the test method and measurement process.
- Evaluate the measurement equations (if available)
- Evaluate the equipment, reference standards, and reagents.
- Identify the minimum required sources of uncertainty.
- Research various sources of information.
- Consult an expert.
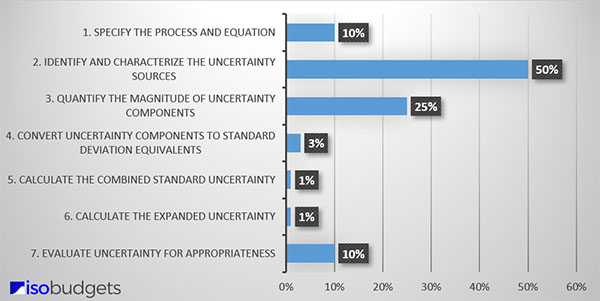
Finding sources of uncertainty can be difficult. It may require a lot of time, effort, and research. Based on my experience, finding uncertainty components typically requires 50% of the time you will spend estimating uncertainty. That makes it the most time-consuming process for evaluating measurement uncertainty.
However, if you spend time evaluating your process and conducting research, you should be able to identify several sources of uncertainty for your analysis. Afterward, make a list of these items. You will attempt to quantify them later.
Step 3: Quantify Sources of Uncertainty
Now that you have identified the sources of uncertainty, you will need to collect and analyze data to quantify them. However, you may need to first estimate uncertainty for the equipment that you use when performing chemical testing, such as:
- Balances,
- Pipettes,
- Volumetric Glassware,
- Thermometers, or
- Other devices
For example, if you use an analytical balance and a pipette to help you prepare a sample with a specific concentration, you will need to estimate uncertainty for your balance and pipette before estimating uncertainty for your sample preparation process.
If your process is not represented with a mathematical equation, you may need to perform robust testing to quantify your uncertainty components. Essentially, you will perform experiments and use the data to help you quantify uncertainty contributors and their sensitivity coefficients.
Two common experiment designs used in robust testing are:
- One Factor At A Time Analysis (i.e. OFAT),
- Full-Factorial Experiments (i.e. Lk)
How to Quantify Uncertainty
To quantify uncertainty, evaluate each stage of the analytical measurement process.
1. Sampling
If you perform sampling, determine the uncertainty in your test results due to sampling. If you do not perform sampling, at least consider evaluating the homogeneity of the samples that you are testing.
2. Sample Preparation
Evaluate your sample preparation process. Typically, you can accomplish this by evaluating the sample preparation equation where each variable in your equation is a potential source of uncertainty.
If your sample preparation process is not represented by an equation, you may want to use Robust testing or One Factor at a Time (OFAT) analysis to help you quantify uncertainty components and any related sensitivity coefficients.
3. Standard Preparation
Similar to sample preparation, evaluate your preparation process and the mathematical equation to determine the uncertainty due to standard preparation. Do not forget to review your standard’s certificate of analysis (COA) to find your reference standard uncertainty.
If your certificate of analysis lists more than one estimate of uncertainty, use the stressed or unstressed uncertainty. Do not use the gravitational uncertainty. It is appropriate for the process used to make the reference standard, but it does not appropriately represent the uncertainty of the standard’s concentration.
4. Equipment Calibration
Evaluate your equipment calibration certificates to calculate uncertainty related to bias, calibration curve, and your reference standard.
5. Sample Analysis
Review your test process and calculate the uncertainty for following items:
- Injection/sample volume
- Detector accuracy
- Detector linearity
- Limit of detection
Next, perform repeatability and reproducibility tests to collect Type A uncertainty data for your analysis.
6. Interpretation of Results
Evaluate your process of interpreting results. You may have additional sources of uncertainty that need to be quantified. Especially, if further calculations need to be performed with the results of sample analysis.
Presentation of Results: RSD & COV
Evaluated uncertainty components for chemical test results are typically presented in relative units of measure, such as percentage (i.e. %). Therefore, it is common to quantify sources of uncertainty in percent values.
Typically, labs will perform calculations to determine:
- Relative Standard Deviation (RSD) or
- Coefficient of Variation (CV)
It is perfectly acceptable to list values in your uncertainty budget using these relative units of measure. Just make sure that your sensitivity coefficients (where applicable) are correct so all of your standard uncertainties are given in the same units (see Step 5).
Step 4: Characterize Sources of Uncertainty
When all of your sources of uncertainty are identified and quantified, your next step will be to characterize each one with an appropriate uncertainty type and probability distribution.
How to Characterize Sources of Uncertainty
To characterize your sources of uncertainty, perform the following tasks below:
- Assign a classification to each source of uncertainty: Type A or Type B,
- Assign a probability distribution to each uncertainty component.
Uncertainty Types
The first step to characterizing your uncertainty components is classifying your uncertainty as Type A or Type B.
Type A Uncertainty
According to the Vocabulary in Metrology (VIM), Type A uncertainty is an “evaluation of a component of measurement uncertainty by a statistical analysis of measured quantity values obtained under defined measurement conditions.”
Type B Uncertainty
According to the Vocabulary in Metrology (VIM), Type B uncertainty is an “evaluation of a component of measurement uncertainty determined by means other than a Type A evaluation of measurement uncertainty.”
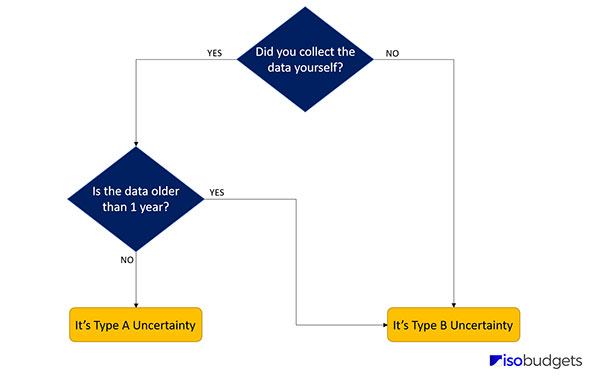
How to Pick an Uncertainty Type
If you are unsure which uncertainty type you should assign, ask yourself the following question:
1. Did you collect the data yourself via testing and experimentation?
- If YES, go to question 2
- If No, choose Type B
2. Is the data older than 1 year?
- If YES, choose Type A
- If No, choose Type B
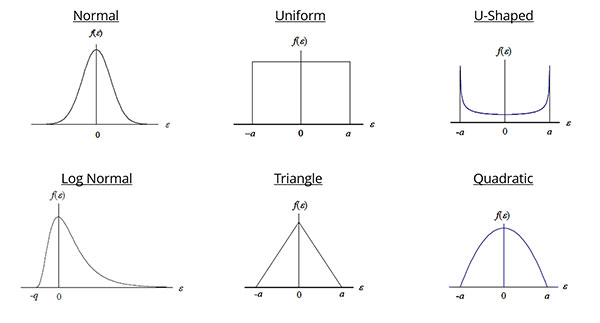
Probability Distributions
This is an important step because the probability distribution that you select will determine how your source of uncertainty is converted to a standard deviation in the next step.
Although there are many different types of probability distributions that you can choose from, the Normal (i.e. Gaussian) and Rectangular (i.e. Uniform) distributions are the most commonly used.
To assign the appropriate distribution, consider how to characterize the data set for each source of uncertainty.
If you evaluated Type A uncertainty data, calibration results, or used an accuracy specification, you most likely want to assign a Normal distribution.
If you evaluated resolution, environmental or physical influences, you may want to use a rectangular distribution.
If you are not sure what distribution you should use, then it is typically less risk to assign a rectangular distribution.
How to Assign a Probability Distribution
Option A: Best for Type A Data
1. Create a histogram from your data set.
2. Evaluate the histogram.
3. Determine the probability distribution that best characterizes the data set.
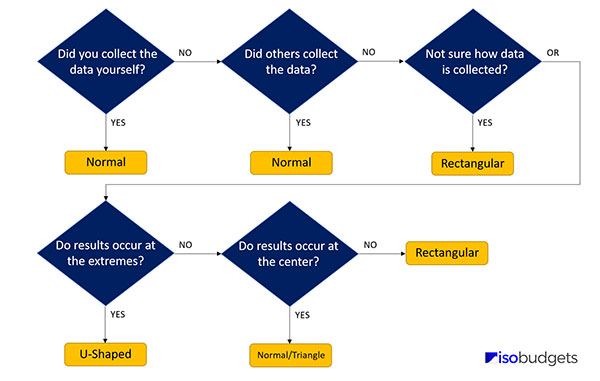
Option B: Best for Type B Data
If you do not want to or cannot create a histogram of your data set, then try answering these questions:
1. Did you collect the data yourself via testing and experimentation?
- If YES, choose Normal.
- If NO, go to question 2.
2. Did others (e.g. manufacture, other lab, etc.) collect the data via testing and experimentation?
- If you think YES, choose Normal.
- If NO, go to question 3.
3. Are you not sure how the data was collected?
- If YES (i.e. if you are not sure), choose Rectangular.
- Or, consider question 4.
4. Are the results expected to occur at the extremes of the range?
- If YES, choose U-Shaped.
- If NO, go to question 5.
5. Are the results expected to occur at the center of the range?
- If YES, choose Normal or Triangle.
- If NO, choose Rectangular.
Step 5: Convert Uncertainty to Standard Deviations
After probability distributions have been selected and assigned, it is time to convert each source of uncertainty to a standard uncertainty or standard deviation equivalent.
How to Convert Uncertainty to Standard Deviations
To convert uncertainty components to standard deviations, follow the steps listed below:
- Assign a probability distribution to each source of uncertainty,
- Find the divisor for the selected probability distribution,
- Divide each source of uncertainty by it’s respective divisor.
Refer to the probability distribution that you selected in step 4 to find the appropriate divisor. Use the chart below for guidance.
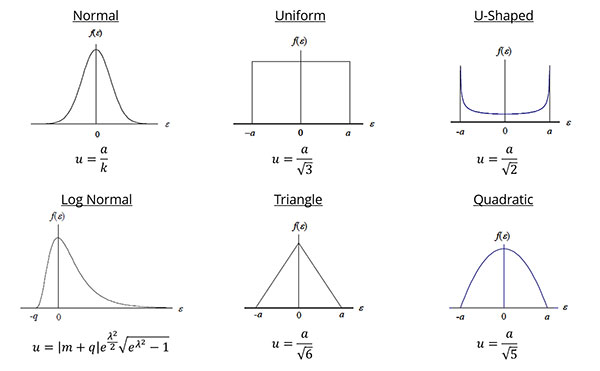
Next, divide your uncertainty components by the appropriate divisor to convert them to a standard uncertainty. Afterward, they should all be on the same confidence level (1-sigma or 68.27%) and equivalent to a standard deviation.
Step 6: Calculate the Combined Uncertainty
Now, it is time to calculate the combined uncertainty using the root sum of squares (i.e. RSS) method referenced in the Guide to the Expression of Uncertainty in Measurement (GUM).
Below, you will see the equation for calculating the combined uncertainty.

If this equation looks confusing to you, try the simplified version below.

This is the equation that I typically use since I usually include sensitivity coefficients (i.e. ci) earlier in the process before I convert uncertainty components to standard deviations.
If you evaluate measurement uncertainty the same way, you should be able to use the simplified equation. If you do not use sensitivity coefficients at all, you can use the simplified equation as well.
In case you use Microsoft Excel to estimate uncertainty, you can combine uncertainty easily using the formula below. It is a combination of the square root and sum of squares function.
How to Calculate the Combined Uncertainty
To calculate the combined standard uncertainty, simply following these instructions:
- Square the value of each uncertainty component,
- Add together all the results in step 1,
- Calculate the square root of the result in step 2.
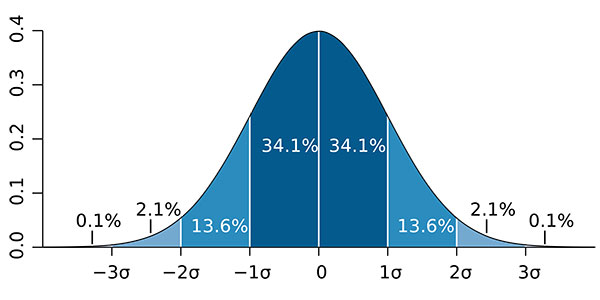
After you complete this process, you will have the combined standard uncertainty at a 1-sigma level (i.e. 68.27% confidence) characterized by a Normal distribution per the Central Limit Theorem.
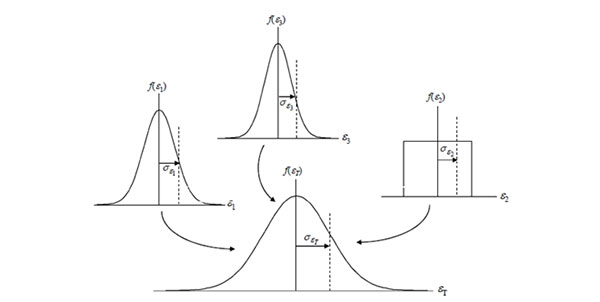
Central Limit Theorem
According to the Central Limit Theorem, the sum of the set of independent random variables (i.e. uncertainty sources) will approach a normal distribution regardless of the individual variable’s distribution.
Therefore, the probability distribution associated with your combined uncertainty will now be normal. Look at the image above for a visual representation.
Step 7: Calculate the Expanded Uncertainty
Next, you will need to calculate the expanded uncertainty to a 95% confidence interval. To do this, you will need to select a coverage factor and multiply it by the calculated combined uncertainty.
How to Calculate the Expanded Uncertainty
To the expanded measurement uncertainty, just follow these steps:
- Calculate the Combined Uncertainty
- Calculate the Effective Degrees of Freedom (optional)
- Find/Select a coverage factor (k), and
- Multiply the combined uncertainty by the coverage factor
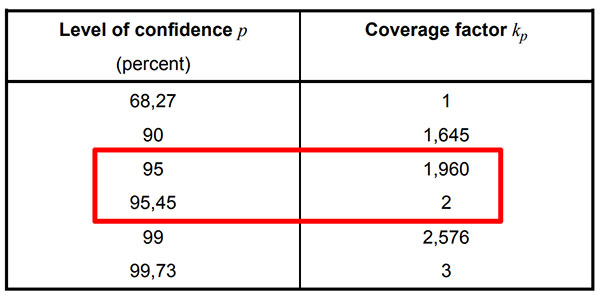
Selecting a Coverage Factor
The coverage factor is the multiplier that you will use to expand uncertainty to a 95% confidence interval. However, you have a couple of options:
- Use k=2 for a 95.45% confidence interval,
- Use k=1.96 for a 95% confidence interval, or
- Use the Student’s T table to find your coverage factor (k).
Note: To use the Student’s T table, you will need to calculate the effective degrees of freedom using the Welch Satterthwaite equation.
TIP: If you struggle with which option you should use, consider this:
- Use a standard k-factor (e.g. 2 or 1.96) when your uncertainty budget contains plenty of sources of uncertainty (Type A and Type B) each with their own value,
- Use the Student’s T table when your uncertainty analysis is limited to mostly Type A data and it is difficult to find or quantify other sources of uncertainty.
Calculating the Expanded Uncertainty
After finding your coverage factor (k), calculate the expanded uncertainty by multiplying the coverage factor and the combined standard uncertainty. Use the formula below for guidance.

The result is the expanded uncertainty (i.e. U). This is your uncertainty in measurement estimated to a 95% confidence interval.
Step 8: Evaluate Your Uncertainty Budget
The final step to estimating measurement uncertainty is to evaluate your results and verify they are appropriate for use. This process is important to ensure that your estimated measurement uncertainty is appropriate for your laboratory activities and not significantly overstated or understated.
How to Evaluate Your Uncertainty Budget
Below are the six best methods for evaluating your results:
- Calculate the significance of each source of uncertainty and evaluate its contribution. Double-check uncertainty components with excessively large and small percentages and verify their value is correct.
- Verify your expanded uncertainty is larger than your Reference Standard Uncertainty,
- Check the BIPM Key Comparison Database and make sure your expanded uncertainty is larger than your national metrology institute (NMI),
- Look up the Certificate of Analysis for a standard reference material that your reference standard is traceable to and verify your uncertainty is larger than the uncertainty of the SRM.
- Compare your estimated uncertainty with other laboratories. Search your accreditation body’s database and look at other laboratory scopes of accreditation.
- Participate in a proficiency testing scheme and compare your uncertainty with other laboratories and determine if your results are reasonable and appropriate. Make sure that you expanded uncertainty is not significantly larger or smaller than other participating laboratories.
Evaluating uncertainty is not easy for most testing laboratories because expanded uncertainties are not typically reported in their scope of accreditation. Therefore, it is hard to compare your activities to other labs.
The best way that I have found for testing labs to compare their results is to review your proficiency testing results. They should include a measurement result and the expanded uncertainty. If your estimate uncertainty is within a reasonable range compared to other test labs, then your uncertainty is most likely appropriate.
If your estimate is not within the range of other labs, then you may want to re-evaluate your uncertainty budgets. You could be overstating or understating your uncertainty. Otherwise, your process may not be consistent with other labs.
The only way to know is to evaluate your results.
Evaluating your uncertainty budgets is not a full-proof process, but it is better than doing nothing. Furthermore, it gives you objective evidence to support your results should an assessor question your expanded uncertainty.
Conclusion
Estimating uncertainty in measurement is not easy. It requires time and effort that a lot of people are not willing to do. However, with the right processes, data sources, and tools, uncertainty analysis does not have to be difficult.
In this guide, you should have learned:
- What is Measurement Uncertainty
- Why is Measurement Uncertainty Important
- What are the Best Uncertainty Guides for Chemical Labs
- How to Estimate Uncertainty for Chemistry Labs
Evaluating measurement uncertainty is a skill. The more you do it, the better you will get at it, and the easier the process will become. So, become a practitioner and start estimating uncertainty.
Click here to download the chemical measurement uncertainty calculator for free!