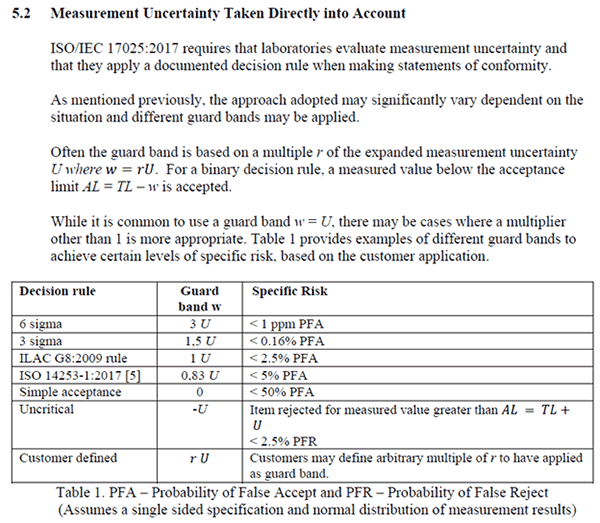
Key Takeaways: Guard Banding Strategies
- Definition: A guard band is a safety margin subtracted from (or added to) a specification limit to account for measurement uncertainty.
- Purpose: To ensure that the probability of a false acceptance (Consumer Risk) remains below a target level, typically 2% or 5% (PFA).
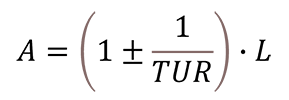
- Formula: Acceptance Limit = Specification Limit – Guard Band.
- Common Methods: Includes simple guard bands (1·U), 6 Sigma guard bands, and the ILAC G8 “Binary Statement” method.
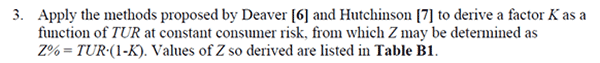
- ISO 17025 Requirement: Crucial for laboratories that must provide a Statement of Conformity with a documented decision rule.
Introduction
There has been a lot of discussion on guard band and guard banding methods lately. Especially, with regard to statements of conformity and decision rules, and how you take uncertainty into account.
This led me to look further into different guard banding methods. Currently, there have been a couple of recommended methods and a lot of opinions. So, I wanted to find out what guard banding methods labs are using and what other options are available.
What I found was astonishing!
Some of the methods that labs are being recommended to use are the worst options for the lab (and its’ customers) in terms of Producer’s Risk and false rejects (You’ll learn more about this later). This may be due to most guides, regulators, and experts presenting information to labs that mostly focuses on false acceptance.
From my research, I found a lot of options. Many that I did not know existed. The more research I did, the more methods that I would find. Some of the guides that experts recommend included additional methods that no one is discussing but may be a viable, easy to implement option for many.
Plus, some of the methods that I found did a much better job of sharing the risk of false accepts (i.e. Consumer’s Risk) and false rejects (i.e. Producer’s Risk) between a lab and it’s customers.
In this guide you are going to learn:
- What is Guard Banding,
- Why Guard Band
- What is Test Uncertainty Ratio
- Guard Banding Methods
- Summary of Guard Banding Methods
- What Method is Best For Your Lab
- Comparison of Guard Banding Methods
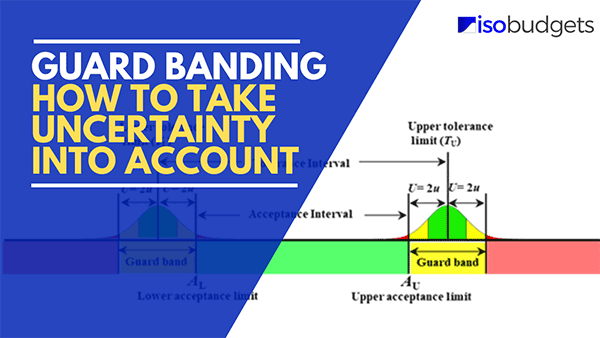
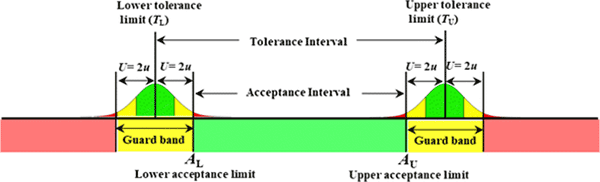
What is Guard Banding
Guard banding is a technique used to reduce the risk of encountering an incorrect conformity decision, such as:
- False Acceptance: Claiming a result is in tolerance when it is out of tolerance.
- False Rejection: Claiming a result is out of tolerance when it is in tolerance.
These events are commonly referred to as Type I and Type II errors.
Look at the image below. It will give you a good idea of what guard banding is and how it is applied.
Why Guard Band
Ultimately, you use guard band methods to prevent the occurrence of false acceptance (Type I Error) and false rejection (Type II Error) errors. Either scenario can have negative effects for the laboratory and its customers.
This is why labs should use guard banding.
Today, most labs are interested in the concept of guard banding as a way of meeting ISO/IEC 17025:2017 requirements. While this is not a bad practice, many labs to do not know why they are guard banding other than to meet a requirement.
However, you should consider the use of guard banding as a way to improve confidence in the results reported by the laboratory.
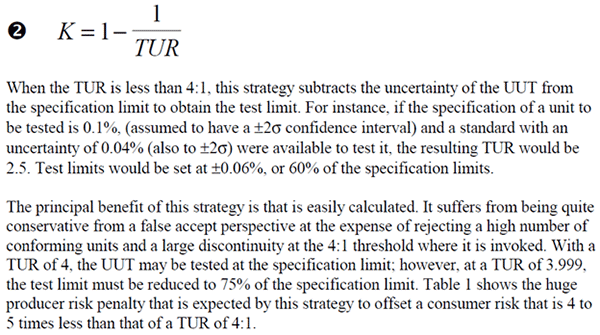
Furthermore, there are plenty of scenarios where a 4:1 TUR is not possible. In these situations, the use of guard banding can help reduce the chance of encountering a false accept or false reject scenario.
Therefore, your “Why” should be to reduce the risk of occurrence of false accepts or false rejects, not just meeting an ISO requirement.
What is Test Uncertainty Ratio
In this guide, you are going to see a lot of references to Test Uncertainty Ratio (TUR). If you are not familiar with it, let me give you a quick summary.
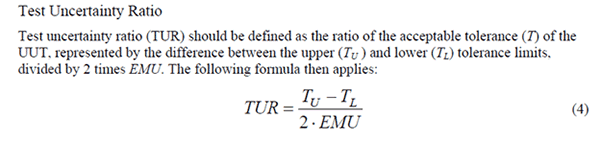
According to the ANSI Z540.3 Handbook, Test Uncertainty Ratio is the ratio of the acceptable tolerance (T) of the Unit Under Test (UUT) to the expanded uncertainty (U) of the measurement process.
The tolerance is represented by the difference between the upper and lower tolerance of the UUT; and, is divided by two times the expanded uncertainty of the measurement process.
Test Uncertainty Ratio Formula
Take a look at the TUR formula given below:

Where,
TUR – Test Uncertainty Ratio
TU – Upper Tolerance Limit
TL – Lower Tolerance Limit
U – Expanded Uncertainty
Test Uncertainty Ratio is commonly used as a performance metric to judge the quality of a measurement result. Currently, the benchmark for TUR is a 4:1 ratio where the expanded uncertainty is 1/4th or 25% of the tolerance.
In most situations, people that evaluate the quality of a measurement result by its TUR typically formulate the following opinions:
- Less than 4:1 TUR is considered less quality, and
- Greater than 4:1 TUR is considered better quality.
Although a 4:1 TUR is not always practical or technically possible, many consider it the standard benchmark to evaluate the quality of a measurement result.
Now that you know what Test Uncertainty Ratio is, the rest of this guide should make more sense. In this guide, you will see references to TUR in most the guard banding methods.
If you want to learn more about Test Uncertainty Ratio, click the link below to read my guide.
Guard Banding Methods
When you need to take uncertainty into account, there are several guard banding methods that you can use. In this section, you will learn about some of the most popular methods used by ISO/IEC 17025 accredited labs.
Altogether, there are 13 guard banding methods covered in this guide. Two of these methods can be found in the ANSI Z540.3 Handbook, three of the methods are from the NCSLi Recommended Practice RP-10, two methods come from the UKAS M3003, and the rest can be found in guard banding papers written by Dave Deaver or Bill Hutchinson back in the 1980’s and 1990’s.
You will notice that 3 of the methods in this guide are duplicates of other methods. The only difference is the resource they came from, and the formulas used to perform guard banding. Even though these methods produce the exact same results, both versions of the method are provided in this guide because the approach to guard banding is presented differently which may make implementation easier for some labs.
The 13 methods that you will learn about in this guide are:
- ANSI Z540.3 Handbook Method 5,
- ANSI Z540.3 Handbook Method 6,
- Constant Consumer Risk (CR4:1),
- ILAC G8 Method,
- ISO 14253-1 Method,
- Guardbanding With Confidence Method 2,
- NCSLi RP-10: Constant Z,
- NCSLi RP-10: Linear Z,
- NCSLi RP-10: Statistical Z,
- Previous NCSLi RP-10 Method,
- Fluke RSS Method,
- UKAS M3003 (3rd ed.) M3, and
- UKAS M3003 (4th ed.) M2.
To learn more about these methods, scroll down and keep reading.
1. Guard Banding per ANSI Z540.3 Handbook Method 5
Guard banding with this method is based on the expanded calibration process uncertainty.
Many people ask, “Do I use the calibration uncertainty per ILAC P14 or the CMC uncertainty?”
Currently, the general consensus (that I have heard from two different committees) is you should use your CMC or calibration process uncertainty and not your calibration uncertainty per ILAC P14 that includes influences from the UUT (i.e. UUT Resolution and UUT Repeatability).
Look at the image below to see an excerpt from the ANSI/NCSL Z540.3-2006 Handbook.
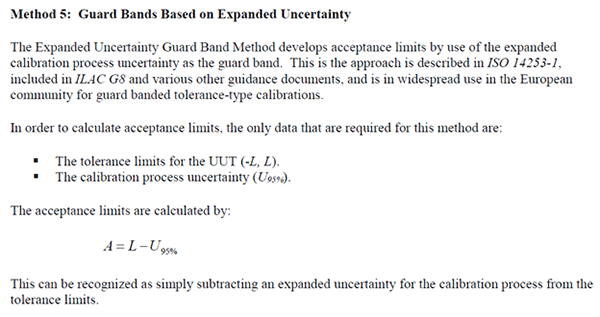
Guard Band Method 5 from the ANSI/NCSL Z540.3-2006 Handbook is one of the simplest and most commonly used guard banding techniques. However, it is one of the worst methods that a lab can use in terms of Producer’s Risk (i.e. false rejects) and cost.
The basic concept is to add and subtract the expanded uncertainty from the tolerance limit before following your decision rules and providing a statement of conformance (e.g. Pass or Fail).
Guard Banding Formula
Below is the formula for Guard Band Method 5 from the ANSI/NCSL Z540.3-2006 Handbook.

Where,
A – Acceptance Limit
L – Tolerance Limit
U95% – Expanded Uncertainty (95% C.I. where k=2)
Instructions
Follow the instructions below to apply this method:
Step 1. Find the value of the Tolerance Limit (L).
Step 2. Find the value of the Expanded Uncertainty (U).
Step 3. Add and Subtract the Tolerance Limit by the Expanded Uncertainty
2. ANSI Z540.3 Handbook Method 6
Another popular guard banding method (especially for labs that are ANSI Z540.3 accredited) is ANSI/NCSLi Z540.3-2006 Handbook Method 6. The guard banding technique used in this method is based on the test uncertainty ratio (TUR).
Look at the image below to see an excerpt from the ANSI/NCSL Z540.3-2006 Handbook.
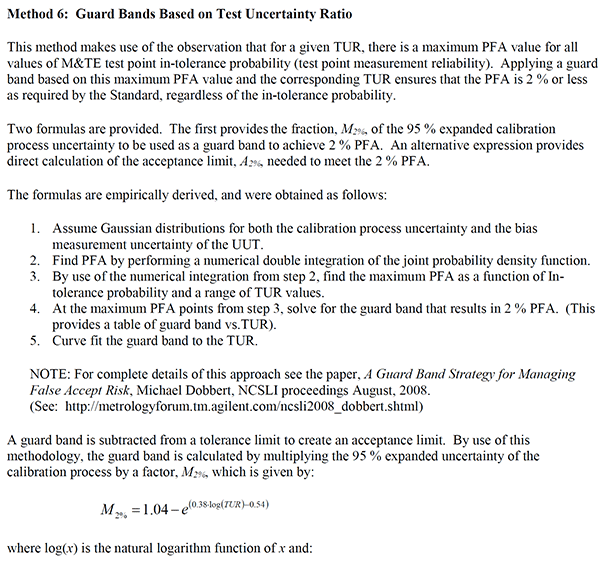
The method was proposed by Mike Dobbert of Keysight Technologies at the 2008 NCSLi Symposium in his paper, “A Guard Band Strategy for Managing False Accept Risk.”
If you would like to read the paper, just click the link below.
A Guard-Band Strategy for False-Accept Management | Keysight
The goal of this method is to adjust your tolerance to an acceptance limit where the maximum probability of false acceptance (PFA) is 2% or less. Originally, it was a solution to meet the 2% PFA requirement of ANSI Z540.3-2006. Now, it is finding popularity again since it has less Producer’s Risk and yields fewer overlap scenarios compared to Method 5 (in the previous section).
Personally, I used this method to comply with ANSI Z540.3-2006 requirements. However, I have never used it to comply with ISO/IEC 17025:2017.
This technique is more advanced but can be automated with software such as Microsoft Excel or Crystal Reports using the formula below.
MS EXCEL: = [Cell L]–[Cell U95%]*(1.04-(EXP((0.38*LN([Cell TUR]))-0.54)))
Guard Banding Formula
Below is the formula for Guard Band Method 6 from the ANSI/NCSL Z540.3-2006 Handbook.

Where,
A2% – Acceptance Limit at 2% maximum PFA
L – Tolerance Limit
U95% – Expanded Uncertainty (95% C.I. where k=2)
TUR – Test Uncertainty Ratio
Note: log(x) in the above equation is a natural logarithm, not a common base 10 logarithm.
Instructions
Follow the instructions below to apply this method:
Step 2. If the TUR is:
- 4 or greater: Do nothing,
- Less than 4: Go to Step 3.
Step 3. Calculate the natural logarithm value of the TUR.
Step 4: Multiply the result from Step 3 by 0.38.
Step 5. Subtract 0.54 from the result from Step 4.
Step 6. Calculate the exponential value with the constant e and the result from Step 5.
Step 7. Subtract 1.04 by the result from Step 6.
Step 8. Multiply the expanded uncertainty by the result from Step 7.
Step 9. Subtract the Limit by the result from Step 8.
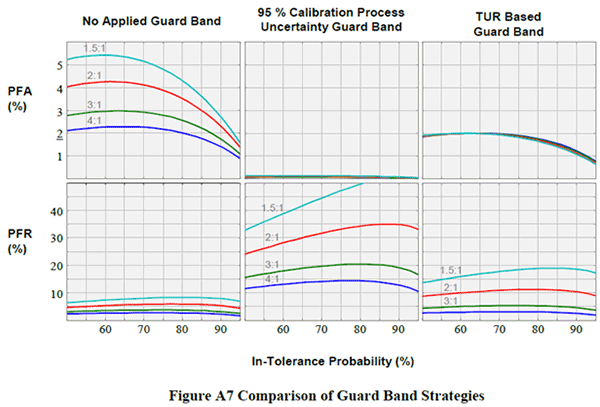
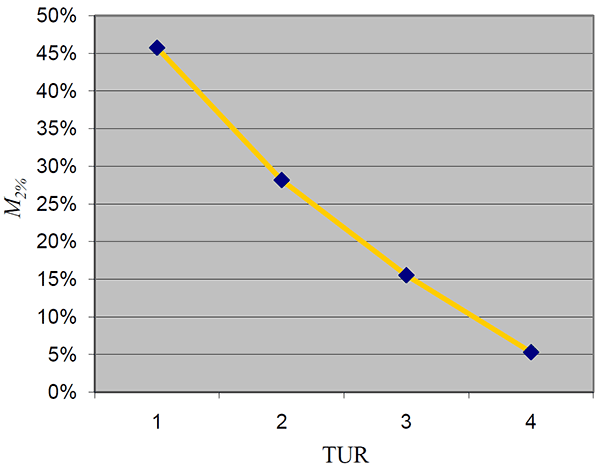
The image below is from the ANSI Z540.3 Handook. Look at the graph. It shows the M2% value guard band factor increases as test uncertainty ratio (TUR) decreases.
- When TUR is 4:1, a guard band of 5.3% is applied to the expanded uncertainty.
- When TUR is 3:1, a guard band of 15.5% is applied to the expanded uncertainty.
- When TUR is 2:1, a guard band of 28.2% is applied to the expanded uncertainty.
- When TUR is 1:1, a guard band of 45.7% is applied to the expanded uncertainty.
If you find the full formula (above) too difficult to use, look at the table below. I have already calculated the M2% values for you.
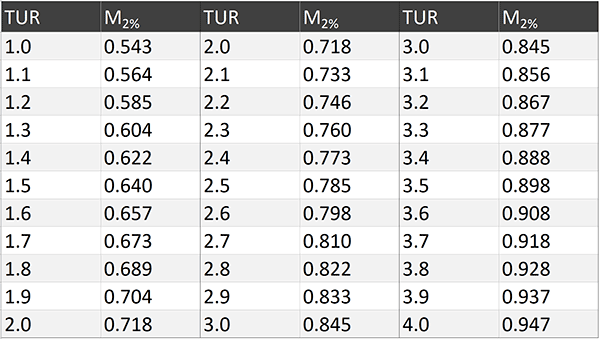
Using the table above you can apply the simplified guard banding equation below to calculate the 2% acceptance limit (A2%).

Instructions
Follow the instructions below to apply this method:
Step 1. Calculate the TUR.
Step 2. Find the M2% value from the above table.
Step 3. Multiply the expanded uncertainty by the M2% value.
Step 4: Subtract the Limit by the result from Step 3.
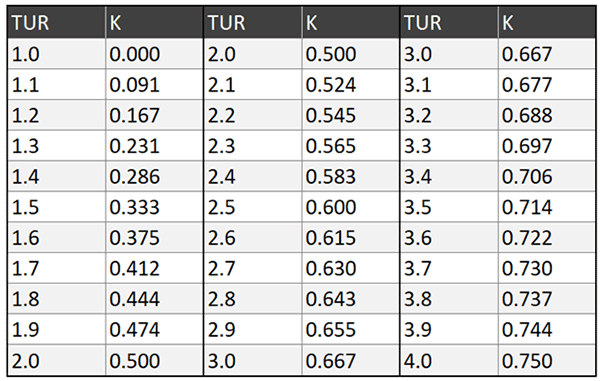
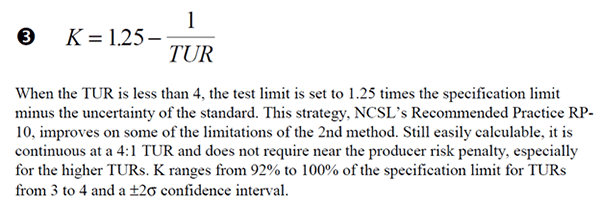
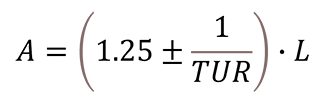
3. Guard Band to the Same Consumer Risk as a 4:1 TUR
This guard banding method allows you to adjust your tolerance limit to the same probability of false acceptance (PFA) risk as a result with a 4:1 test uncertainty ratio (TUR).
The method has been found in the following papers:
- “How to Maintain Your Confidence” by Dave Deaver, and
- “Setting Guardband Test Limits to Satisfy MIL-STD-455662A” by Bill Hutchinson
Look at the image below to see an excerpt from the “Guardbanding With Confidence.”
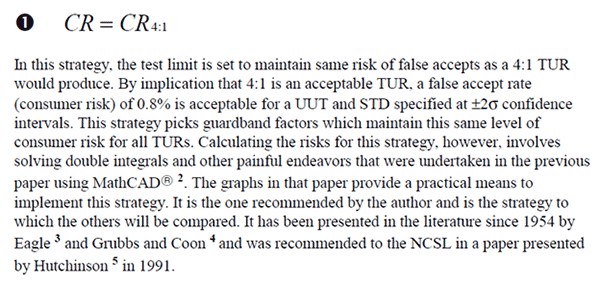
The benefit of this technique is the consumer’s risk (i.e. probability of false acceptance) is consistently 0.8% and the Producer’s Risk (i.e. probability of false rejection) is quite low in comparison to other methods.
Guard Banding Formula
Below is the guard band formula from Dave Deaver’s paper.

Where,
A – Acceptance Limit
L – Tolerance Limit
K – Guard Band Correction Factor
The image below is from Dave Deaver’s paper, “How to Maintain Your Confidence.” Focus your attention on the graph on the right side. It shows the correction factors for guard banding your tolerances to match the consumer’s risk to the same probability (i.e. 0.8%) as having a test uncertainty ratio (TUR) of 4:1.
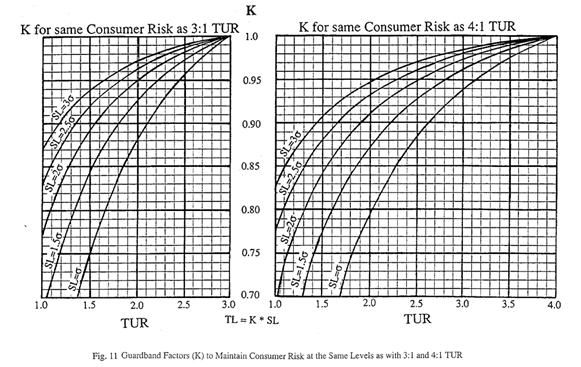
The graph is a nice tool to have but interpreting the value of K can be difficult without a function or formula. To help you out, I created the table below. It gives you the value of K based on the value of TUR in tenths of a digit.
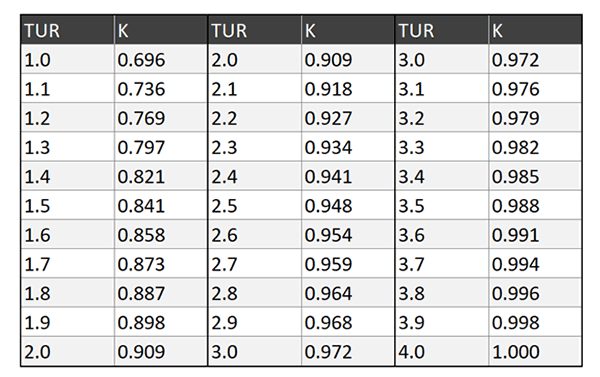
Instructions
Follow the instructions below to apply this method:
Step 2. If the TUR is:
- 4 or greater: Do nothing,
- Less than 4: Go to Step 3.
Step 3: Find the correction factor (K) the table (in this section),
Step 4: Multiply the Limit by the result of Step 3.
4. Guard Banding per ILAC G8
With this guard banding technique, you adjust your tolerance limit based on your expanded uncertainty.
Similar to the ANSI Z540.3 Handbook Method 5, the ILAC G8 method has you simply add or subtract your expanded uncertainty from your tolerance.
The process is very simple, but has an extremely high producer’s risk.
Look at the image below to see an excerpt from the “ILAC G8:09/2019.”
Further down, you will see an alternative version of this based on the test uncertainty ratio.
Guard Banding Formula
Below is the guard band formula from the “ILAC G8:09/2019.”

Where,
A – Acceptance Limit
L – Tolerance Limit
U – Expanded Uncertainty (95% C.I. where k=2)
Instructions
Follow the instructions below to apply this method:
Step 1. Find the value of the Tolerance Limit (L).
Step 2. Find the value of the Expanded Uncertainty (U).
Step 3. Add and Subtract the Tolerance Limit by the Expanded Uncertainty
5. Guard Banding per ISO 14253-1
This guard banding technique has you adjust your tolerance limit based on your expanded uncertainty.
When taking uncertainty into account, the ISO 14253-1 method has you consider 83% of your expanded uncertainty instead of 100% of your expanded uncertainty compared to the ILAC G8 rule.
The advantage of this method is you have a 5% probability of false acceptance (PFA) and a smaller probability of false rejection (PFR) compared to the ILAC G8 method.
Some guides and papers claim this method is the same as the ILAC G8 method, but you can see from the image below that they are not. Look at the image below to see an excerpt from the “ILAC G8:09/2019.”

Guard Banding Formula
Below is the guard band formula from the “ISO 14253-1.”

Where,
A – Acceptance Limit
L – Tolerance Limit
U – Expanded Uncertainty (95% C.I. where k=2)
Instructions
Follow the instructions below to apply this method:
Step 1. Find the value of the Tolerance Limit (L).
Step 2. Find the value of the Expanded Uncertainty (U).
Step 3. Multiply the Expanded Uncertainty (U) by 0.83.
Step 4. Add and Subtract the Tolerance Limit by the result from Step 3.
6. Guard Banding Based on Test Uncertainty Ratio (TUR)
This guard banding technique has you adjust your tolerance limit based on the test uncertainty ratio.
I found this method in Dave Deaver’s paper, “Guardbanding With Confidence.” There are a lot of published papers that claim this method came from ILAC G8 and ISO 14253-1. However, I have not seen the equation written this way when in either document.
Furthermore, I have not found this equation written the same way in any reference document.
I can see how it is confused with the ILAC G8 method. This method produces the same results as the:
- ILAC G8 rule, and
- ANSI Z540.3 Handbook Method 5
However, the formula is different.
Look at the image below to see an excerpt from “Guardbanding With Confidence.”
Guard Banding Formula
Below is the guard band formula from Dave Deaver’s paper.
Where,
A – Acceptance Limit
L – Tolerance Limit
TUR – Test Uncertainty Ratio
Instructions
Follow the instructions below to apply this method:
Step 2: If the TUR is:
- 4 or greater: Do nothing,
- Less than 4: Go to Step 3.
Step 3: Divide one (1) by the TUR,
Step 4: Subtract 1 by the result of Step 3,
Step 5: Multiply the Limit by the result of Step 4.
Guard Banding Factor
The chart below shows the guard banding factor (w) based on the TUR using the equation given above. To calculate your acceptance limit, simply multiply the guard banding factor and your tolerance.
Guard Banding Factor for Acceptance Limit
Look at the table below to see the guard banding factors calculated with this method. Simply multiply the guard banding factor (K) associated with the TUR and the tolerance limit. The result will be your acceptance limit.
Guard Banding Factor for Rejection Limit
Look at the table below to see the guard banding factors calculated with this method. Simply multiply the guard banding factor (K) associated with the TUR and the tolerance limit. The result will be your rejection limit.
7. NCSLi Recommended Practice RP-10: Constant Z
The NCSLi Recommended Practice 10 has 3 guard banding methods in it. The first recomends applying a constant guard banding factor of 80%.
Essentially, you add or subtract 80% of expanded uncertainty to or from the tolerance limit.
I used this method (all of the time) years ago, but never knew where it came from.
Look at the image below to see an excerpt from the “NCSLi Recommended Practice 10.”
Guard Banding Formula
Below is the guard band formula from NCSLi RP-10 for Constant Z.

Where,
A – Acceptance Limit
L – Tolerance Limit
U – Expanded Uncertainty
Instructions
Follow the instructions below to apply this method:
Step 1: Calculate the expanded uncertainty.
Step 2: Multiply the expanded uncertainty by 0.8.
Step 3: Add or subtract the tolerance limit by the result from Step 2.
8. NCSLi Recommended Practice RP-10: Linear Z
This method is the second guard banding method recommended by the NCSLi RP-10. The guard banding factor, Z, is calculated based on the linear function provided below.
Look at the image below to see an excerpt from the “NCSLi Recommended Practice 10.”
![]()
I have never seen this method before, so it is new to me. Currently, I am not aware of anyone that uses it.
Guard Banding Formula
Below is the guard band formula from NCSLi RP-10 for Linear Z.

Where,
A – Acceptance Limit
L – Tolerance Limit
U – Expanded Uncertainty
TUR – Test Uncertainty Ratio
Instructions
Follow the instructions below to apply this method:
Step 2: Calculate the test uncertainty ratio.
Step 3: If the TUR is:
- 4 or greater: Do nothing,
- Less than 4: Go to Step 4.
Step 4: Multiply the TUR by 0.2.
Step 5: Subtract 0.8 by the result of Step 4.
Step 6: Add or subtract the tolerance limit by the result from Step 5.
9. NCSLi Recommended Practice RP-10: Statistical Z
This method is the third guard banding method recommended by the NCSLi RP-10. The guard banding factor, Z, is calculated based on the statistical function provided below.
Look at the image below to see an excerpt from the “NCSLi Recommended Practice 10.”
This is the same method given earlier for consumer risk equal to a 4:1 TUR. However, the NCSLi RP-10 writes and applies the formula differently. I am not sure why the method is applied differently, but the result is still the same.
Guard Banding Formula
Below is the guard band formula from NCSLi RP-10 for Statistical Z.
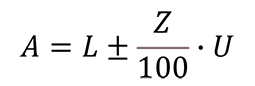
Where,
A – Acceptance Limit
L – Tolerance Limit
U – Expanded Uncertainty
Z – Constant Consumer Risk Factor based on TUR (%)
TUR – Test Uncertainty Ratio
Instructions
Follow the instructions below to apply this method:
Step 2: Calculate the test uncertainty ratio.
Step 3: If the TUR is:
- 4 or greater: Do nothing,
- Less than 4: Go to Step 4.
Step 4: Find Z from the table below.
Step 5: Divide Z by 100 (because it is a percentage).
Step 6: Multiply the expanded uncertainty by the result of Step 5.
Step 7: Add or subtract the tolerance limit by the result from Step 6.
Guard Banding Factor for NCSLi RP-10: Statistical Z
Below is a table with the Guard Band factor K for NCSLi RP-10, Statistical Z method.
10. Guard Banding Method from Previous Version of NCSLi RP-10
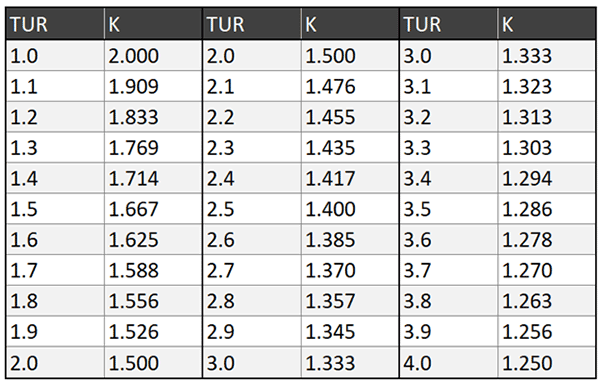
This method is from Dave Deaver’s paper, “Guardbanding With Confidence.” It allows you to adjust your tolerance based on the value of the test uncertainty ratio.
Look at the image below to see an excerpt from the “Guardbanding With Confidence.”
The paper claims that this method was published in NCSLi Recommended Practice RP-10. However, it is not in the current version of the document. It may have been in a previous version of NCSLi RP-10 and removed or replaced by the methods in the current version.
I included the method in this guide because Dave Deaver claimed this method had a much better producer’s risk at higher test uncertainty ratios (e.g. 4:1 or greater) compared to other guard banding methods given in this document; specifically ILAC G8, ISO 14253-1, and ANSI/NCSLi Z540.3 Handbook Method 5.
Guard Banding Formula
Below is the guard band formula from Dave Deaver’s paper, “Guardbanding With Confidence.”
Where,
A – Acceptance Limit
L – Tolerance Limit
TUR – Test Uncertainty Ratio
Instructions
Follow the instructions below to apply this method:
Step 2. If the TUR is:
- 4 or greater: Do nothing,
- Less than 4: Go to Step 3.
Step 3: Divide one (1) by the TUR,
Step 4: Subtract 1.25 by the result of Step 3,
Step 5: Multiply the Limit by the result of Step 4.
11. Guard Banding with Fluke’s RSS Strategy
This method is also from Dave Deaver’s paper, “Guardbanding With Confidence,” and adjusts your tolerance based on the value of the test uncertainty ratio.
Look at the image below to see an excerpt from the “Guardbanding With Confidence.”
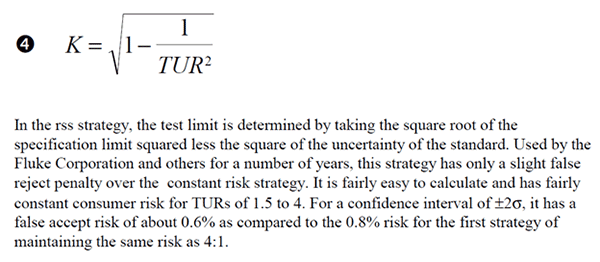
According to the paper, this guard banding method was used by Fluke in the 1990’s. I am not sure if Fluke still uses it today.
The benefit to this method is it has both a low consumer’s risk and a low producer’s risk.
Guard Banding Formula
Below is the guard band formula from Dave Deaver’s paper, “Guardbanding With Confidence.”
Where,
A – Acceptance Limit
L – Tolerance Limit
TUR – Test Uncertainty Ratio
Instructions
Follow the instructions below to apply this method:
Step 2. If the TUR is:
- 4 or greater: Do nothing,
- Less than 4: Go to Step 3.
Step 3: Square the TUR,
Step 4: Divide one (1) by the result of Step 3,
Step 5: Add or Subtract 1 by the result of Step 4,
Step 6: Calculate the square root of the result in Step 5,
Step 7: Multiply the Limit by the result of Step 6.
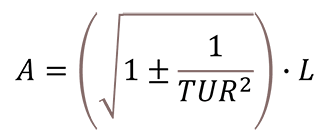
12. Guard Banding with UKAS M3003 3rd Edition, Section M3
This method comes from the 3rd edition of the UKAS M3003 guide, but was removed in the 4th edition of the document. It is exactly the same as the Fluke RSS method. The equation is different, but the results are identical.
Look at the image below for an excerpt from the “UKAS M3003 3rd edition.”
The method is simple to use. Just calculate the root sum of squares (RSS) with your tolerance limit and expanded uncertainty. This can be easily performed in Microsoft Excel and Crystal Reports.
Guard Banding Formula
Below is the guard band formula from the UKAS M3003 3rd Edition, Section M3:

Where,
A – Acceptance Limit
L – Tolerance Limit
U – Expanded Uncertainty
Instructions
Follow the instructions below to apply this method:
- If Yes: Go to Step 2,
- If No: Stop and use a different method.
Step 2: Square the Limit,
Step 3: Square the Expanded Uncertainty,
Step 4: Subtract the result of Step 2 by the result of Step 3,
Step 5: Calculate the square root of the result in Step 4.
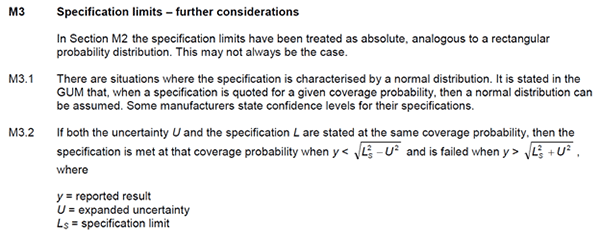
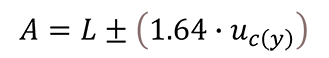
13. Guard Banding with UKAS M3003 4th Edition, Section M2
This method comes from the 4th edition of the UKAS M3003 guide, section M2. This method was also available in the 3rd edition of the UKAS M3003.
Look at the image below to see an excerpt from the “UKAS M3003 4th edition.”
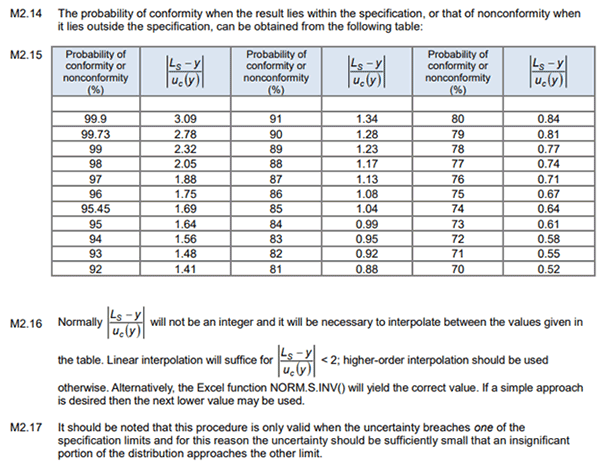
This method is explained and applied differently in the UKAS M3003 guide (see the image above) than how it is presented below. However, the modification below has been used by labs to guard band tolerances to a 95% confidence level.
Guard Banding Formula
Below is the guard band formula from the UKAS M3003 4th Edition, Section M2:
Since this method requires the use of the combined standard uncertainty, I have modified the formula to make it easier for you to find your combined uncertainty. Now, all you need is your expanded uncertainty and your coverage factor (typically, k=2).
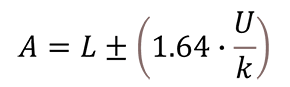
Where,
A – Acceptance Limit
L – Tolerance Limit
U – Expanded Uncertainty
k – Coverage Factor (typically k=2)
Instructions
Follow the instructions below to apply this method:
Step 1. Divide the Expanded Uncertainty by the Coverage Factor,
Step 2: Multiply the result of Step 1 by 1.64,
Step 3: Add or Subtract the Tolerance Limit by the result of Step 2.
Summary of Guard Banding Methods
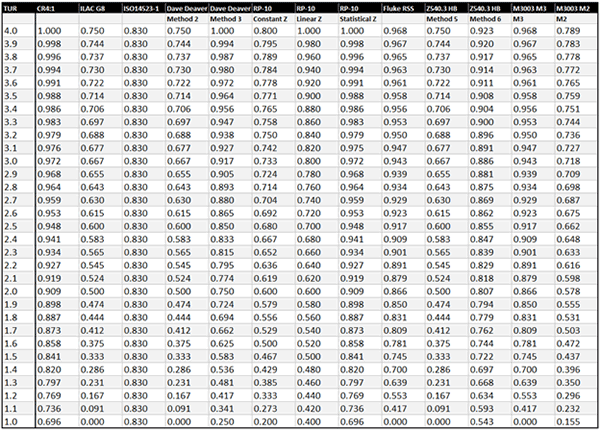
Now that you have learned about each one of these methods, I thought that it would be beneficial to see a summary of each method all in one table.
In the table below, you will see each method in the form of guard banding factor, K, versus test uncertainty ratio (TUR). This makes it easy to compare the guard banding factor of each method.
Acceptance Limit
If you want to apply one of these methods to your results, use the formula below. Simply, find the guard banding factor (K) from the table and multiply it and your tolerance limit to find your acceptance limit.

Where,
A – Acceptance Limit
L – Tolerance Limit
K – Guard Band Correction Factor
Rejection Limit
If you want to find your rejection limit, use the modified formula below. Simply, find the guard banding factor (K) from the table, divide one by the guard banding factor, and multiply it with your tolerance limit to find your rejection limit.
Where,
A – Acceptance Limit
L – Tolerance Limit
K – Guard Band Correction Factor
Observations
After looking at the table, you will notice that some of the methods produce the exact same results. Here is a list of the methods with similar results:
- The consumer risk equivalent to 4:1 TUR method is the same as NCSLi RP-10 Statistical Z method.
- The ILAC G8 / ISO 14253-1 method is the same as the ANSI Z540.3 Handbook Method 5.
- The Fluke RSS method is the same of the UKAS M3003 3rd edition M3 method.
This may help you when deciding which method you would like to use.
Which Method is Best For You
To determine which method is best for you, it is important to understand producer’s risk and consumer’s risk.
The definitions below have been modified to help you understand how they relate to your laboratory activities.
Consumer’s Risk
Consumer’s Risk is the chance that your measurement results do not meet specifications, go undetected, and affect subsequent results (which can affect quality, safety, reputation, health, life, etc.).
Essentially, consumer’s risk is the chance that you pass or accept measurement results that should have been rejected.
Producer’s Risk
Producer’s Risk is the chance that you reject measurement results that should have passed or been accepted.
Now that you understand the risks involved, you need to determine the goal your laboratory wants to achieve.
Do you want to optimize for:
- Minimizing producer’s risk,
- Minimizing consumer’s risk,
- Sharing the risk equally, or
- Another goal?
This is important to know. It will help you determine with method works best for your laboratory.
Minimizing Producer’s Risk
If minimizing producer’s risk is your goal, pick the method that gives your lab the least risk of encountering an out-of-tolerance or overlap condition.
Minimizing Consumer’s Risk
If minimizing consumer’s risk is your goal, pick the method that gives your customer the least risk of encountering an false accept or false reject.
Sharing the Risk
If balancing risk is your goal, pick the method that does the best job of sharing the risk equally between the lab and the customer.
Comparison of Guard Banding Methods
A good way to find the right method for your lab is to compare the consumer’s and producer’s risk associated with each guard banding method.
In the table below, you will see a summary of the consumer’s risk associated with each method. You will notice that the table is incomplete because this information is limited. Most of the information in this table came from papers and guides published about these guard banding methods.
I only filled in the data that I could find. The rest will be determined later when I have an opportunity to calculate the values myself.
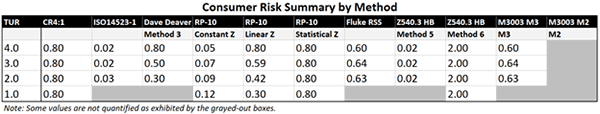
Looking at the table above, you will notice that each one of these methods significantly reduces the consumer’s risk or the chance of having a false acceptance. This is good for laboratory customers.
However, each method comes with a cost of increasing producer’s risk or the chance of having a false rejection. This is bad for laboratories.
In the table below, you will see a summary of the producer’s risk associated with each method. You will notice that the table is incomplete because this information is limited. Most of the information in this table came from papers and guides published about these guard banding methods. The rest will be determined later when I have an opportunity to calculate the values myself.
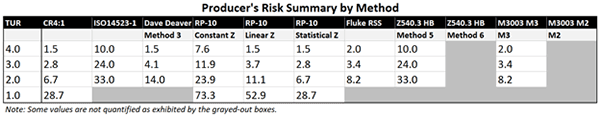
Looking at the table above, you will notice that the producer’s risk has a lot of variance between the methods. This means that the method that your laboratory uses could have a negative impact on your lab and its customers.
Here is a list of negative impacts that false rejections can cause:
- Angry customers due to more rejections,
- Loss to reputation when you reject an item that another lab does not,
- Loss of revenue when customers decide to use another lab,
- Increased costs due to retesting or recalibration, and
- Increased costs due to increased nonconformities.
Considering the risks, you should evaluate the guard banding method that you are using and select the method that would be best for your lab and it’s customers.
Conclusion
For laboratories that take uncertainty into account when providing statements of conformity, guard banding methods are becoming a popular tool for labs meeting ISO/IEC 17025:2017 requirements; specifically for providing statements of conformity and decision rules
Most laboratories (that provide statements of conformity) use the same method when taking uncertainty into account because it is recommended by the ILAC G8 guide, promoted in training classes, and easy to implement.
The bad news is the most popular method used by labs is putting them and their customers at a major risk for reporting false rejections (i.e. Producer’s Risk).
In this guide, you have learned about 11 guard banding methods, including the:
- Name of the guard banding method,
- Resources that the method is derived from,
- Guard banding formula used to implement it, and
- Risks (i.e. Consumer and Producer’s Risk) associated with each method.
With this information, you should be able to select and implement a method that works best for your laboratory and customers. With the information provided in this guide, I recommend that you quit using the ILAC G8 method and start using a different method.
In my professional opinion, I like the Constant Consumer Risk (CR4:1) and the Fluke RSS method. They both have a low consumer risk and a reasonable producer’s risk that I think is a happy middle ground for both the laboratory and its customers.
Which method do you use and why?
Leave a comment below and let me know.
Summary of Changes:
This guide was originally published on 12/07/2021 and updated on 09/16/2022 to update the ANSI Z540.3 method 6 section. There was an important note on the log function (originally left out) added to the guide. Additionally, a simplified version of the ANSI Z540.3 method 6 formula including a supporting graph and table were added to the guide.