
Introduction
Estimating uncertainty can be a difficult task, especially if you are a beginner. Tools like an uncertainty budget or calculator can really make a big difference.
However, software to calculate uncertainty is typically outdated, expensive, and difficult to learn.
Many people have problems because they do not know what to do or where to begin.
Luckily, there is an easier way!
You don’t need expensive software to estimate uncertainty. All you need is a program named Microsoft Excel.
In fact, you probably have Microsoft Office on your computer. Therefore, the cost for you to begin to calculate uncertainty with Excel is zero.
In this guide, I am going to show you how to create an uncertainty budget in Excel so you can estimate uncertainty in measurement for ISO/IEC 17025 accreditation.
So, keep reading. I am going to show you how to;
1. Create an uncertainty budget in Excel,
2. Add functions to automatically calculate uncertainty, and
3. Validate that your uncertainty calculator functions correctly.
Background
When I first began to estimate uncertainty, I spent months buying and trying all kinds of software that was supposed to help me calculate uncertainty.
It was awful!
I wasted many hours searching for software, buying it, downloading it, installing it, and testing it only to find out that it didn’t calculate uncertainty like I thought it would.
Finally, I stumbled across the Hewlett Packard’s UnCal 3.2. It was the best program (at the time) that helped me estimate uncertainty. Best of all, it was free!
I used it to prepare for an ISO/IEC 17025 accreditation audit where I had to estimate uncertainty for the laboratory’s entire 25-page scope of accreditation.
At the time, I inherited a metrology program that had based all of it’s uncertainty statements on manufacturer’s specifications.
Most of the scope of accreditation was not supported with any uncertainty budgets. The few parameters that did have uncertainty budgets were awful and didn’t make much sense.
Every measurement parameter needed an uncertainty budget and I had to start from scratch!
The worst part was, I had three months to get it done and I didn’t have a clue what I was doing.
Needless to say, I got hit hard during the assessment. Most of deficiencies were related to missing uncertainty budgets.
Nearly 70% of my scope of accreditation was marked “TBD.”
It was embarrassing!
As a result, I spent the next 6 months creating uncertainty budgets and living off of scope extensions. It was not fun.
Luckily, A2LA agreed to work with me throughout the process while I created uncertainty budgets for my entire scope of accreditation.
After spending 9 months of my life calculating uncertainty, here is what I learned;
• I learned a lot about estimating uncertainty,
• I learned a lot about my calibration laboratory,
• I hated measurement uncertainty software, and
• I learned Microsoft Excel was great for calculating uncertainty.
Since then, I have used Microsoft Excel (almost exclusively) to create uncertainty budgets for estimating uncertainty.
So, if you are interested in using Excel to calculate uncertainty in measurement, let me show you how to create a powerful uncertainty budget calculator.
What Is An Uncertainty Budget

According the Vocabulary in Metrology (VIM), an uncertainty budget is a statement of a measurement uncertainty, and of their calculation and combination.
Essentially, it is a document that describes how you estimated uncertainty in measurement including the components and calculations.
For a better understanding, read the note below the definition. It states that an uncertainty budget should include the following information;
1. Measurement model
2. Estimates,
3. Uncertainties for quantities in the measurement model,
4. Covariances,
5. Probability distributions,
6. Degrees of freedom,
7. Type of Evaluation (i.e. Uncertainty Type), and
8. Coverage factor
Following the list above will help you create an uncertainty budget. However, I recommend that you include more information.
Take a look at section 7.1.4 of The Guide to the Expression of Uncertainty in Measurement (GUM). It offers some great advice about creating uncertainty budgets. The last phrase is my favorite!
“7.1.4 Although in practice the amount of information necessary to document a measurement result depends on its intended use, the basic principle of what is required remains unchanged: when reporting the result of a measurement and its uncertainty, it is preferable to err on the side of providing too much information rather than too little. For example, one should
a) describe clearly the methods used to calculate the measurement result and its uncertainty from the experimental observations and input data;
b) list all uncertainty components and document fully how they were evaluated;
c) present the data analysis in such a way that each of its important steps can be readily followed and the calculation of the reported result can be independently repeated if necessary;
d) give all corrections and constants used in the analysis and their sources.
A test of the foregoing list is to ask oneself “Have I provided enough information in a sufficiently clear manner that my result can be updated in the future if new information or data become available?”
Therefore, to create a great uncertainty budget, make sure that you include enough information to repeat the process in the future.
I recommend that you include as much information as you can in your uncertainty budgets. You can always remove information that is useless or unnecessary later.
It’s more difficult to add important information after the analysis has been completed. Proportionally, the more time that elapses since the analysis, the more difficult it will become to recall how you estimated measurement uncertainty.
Take it from me. It is rather embarrassing when an assessor asks you to explain your uncertainty analysis and you cannot remember how you achieved the results.
Leaving out important details and information about your uncertainty calculations is only setting yourself up for failure.
So, make sure to provide plenty of information in your uncertainty budgets and update them routinely (e.g. every 12 to 24 months) to recall how you estimated uncertainty.
If you need help, I have included a section in this guide that will show you what factors I include in my uncertainty budgets.
Why Is It Important
Uncertainty budgets are important because they provide detailed information for how you estimate uncertainty.
Additionally, uncertainty budgets are important if you want your laboratory to be ISO/IEC 17025 accredited.
As an accredited laboratory, you are required to estimate uncertainty for the test and measurement functions your organization will be accredited to perform.
An uncertainty budget is the tool that you will use to estimate measurement uncertainty to support your scope of accreditation. Without it, you will have a difficult time getting accredited.
Therefore, you need an uncertainty budget. It will help you convey to others exactly how you estimated uncertainty.
If you want to make the process easier, you will want to make sure that your uncertainty budget can function as an uncertainty calculator. It will save you a lot time that can be better spent elsewhere.
What To Include In An Uncertainty Budget
To calculate uncertainty effectively, you should consider including the following elements in your uncertainty budgets.
1. Definition of Measurand
2. Uncertainty Source or Component,
3. Sensitivity Coefficient,
4. Uncertainty Value,
5. Unit of Measure,
6. Uncertainty Type
7. Probability Distribution,
8. Divisor,
9. Standard Uncertainty,
10. Degrees of Freedom,
11. Significance or Influence on Total Combined Uncertainty,
12. Combined Uncertainty,
13. Total Effective Degrees of Freedom,
14. Coverage Factor,
15. Expanded Uncertainty, and
16. Notes, References, and Comments.
I know that this may seem like a lot of information; but, it is important for explaining how you estimated uncertainty. Plus, you can use some of the additional information to help you reduce measurement uncertainty.
In the example below, you will see how I typically include these elements into my uncertainty budgets.
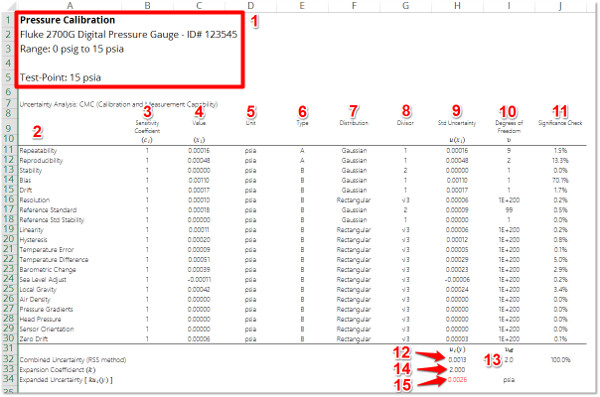
DISCLAIMER: The uncertainty budget examples shown in this guide are for reference only and do not represent an actual measurement uncertainty analysis for the identified item.
Uncertainty Budget Design & Format
While there are several formats that can be used, most people tend to use a table format to demonstrate how they calculate uncertainty.
In fact, I prefer to use a table format to present the information in a clean and simple way that makes my analyses easy to read and understand.
Look at the image below to see how I format my uncertainty budgets.
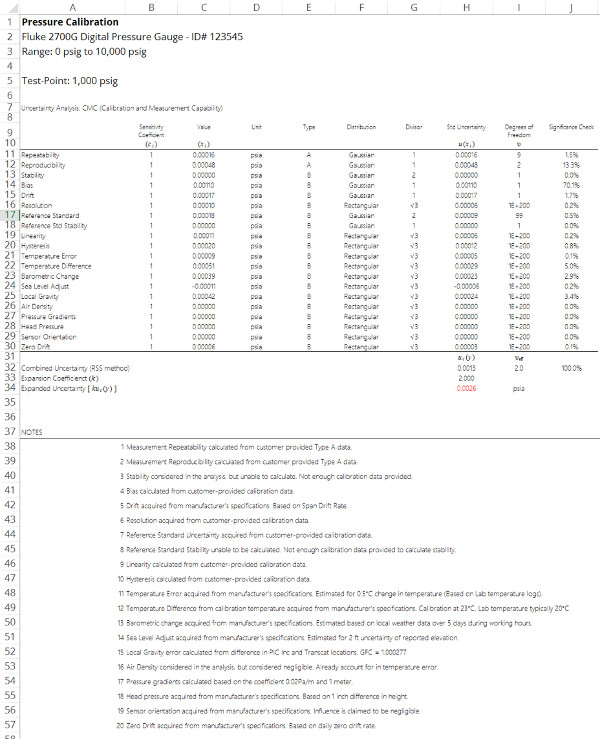
If you notice, I use rows to list each uncertainty contributor and columns to provide important details about each contributor. This makes it easy to keep an uncertainty budget organized and consistent.
Additionally, I prefer to use lines to only separate important information. This minimizes distractions, eye strain, and reduces the amount of ink required for printing.
With a clean and simple format (like the example above), you can make your uncertainty budgets easy to read and understand how uncertainty is calculated. Additionally, a minimalist design will keep your file sizes small and reduce your printing costs.
However, I have seen amazing uncertainty budgets that use borders and colors in their design. The format is entirely up to you. Just make sure that you can quickly read and understand the information when needed. That’s what is really important.
How To Create An Uncertainty Budget In Excel (Step-by-Step)
Creating an uncertainty budget is actually pretty simple if you are using Microsoft Excel. However, most people seem to have trouble using Excel’s functions.
If you are not familiar with Excel, adding formulas and functions can seem like an overwhelming task.
Luckily for you, I have outlined the process below with step by step instructions. Follow them and you can create a fully functional uncertainty calculator in less than 20 minutes.
After creating your uncertainty budget, you should save the file as a template that you can use each time you need to calculate uncertainty. This will ensure that your process is repeatable and prevent you from making mistakes and miscalculations.
If you are ready to create an uncertainty budget, let’s begin.
1. Open Microsoft Excel and create a new spreadsheet
To create an uncertainty budget, get started by opening Microsoft Excel and creating a ‘New’ workbook.
When you first open the Excel program, you should see a screen that looks like this.
There will be several options to choose from, but you simply want to start with a blank workbook.
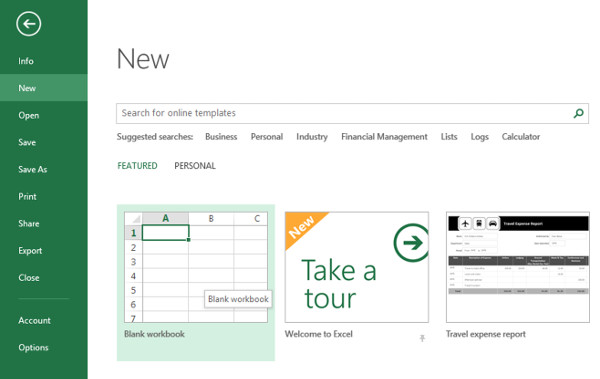
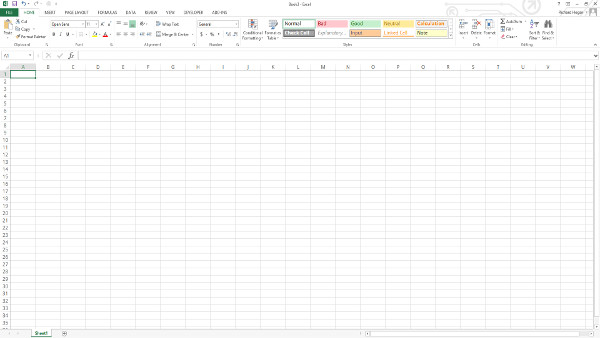
Select “Blank Workbook” to open a new spreadsheet like in the image below.
2. Give your spreadsheet a name and title
This is a great time to create a name and title for your uncertainty budget.
I recommend that you use this opportunity to define your measurement function or test method.
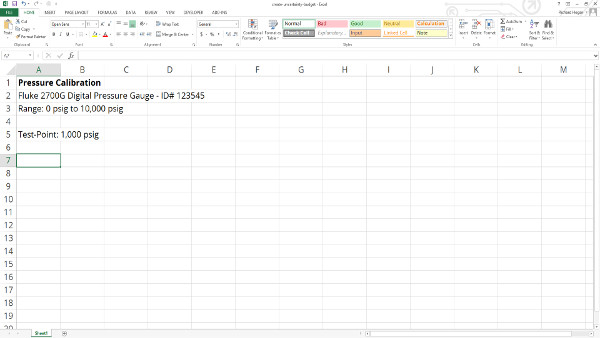
For example, I always use the first four rows to define;
• Measurement Function,
• Description of the equipment or method used.
• Measurement Range, and
• The Measurement Value
To see how I define the measurement function, look at the image below.
Now, before you do anything else, save your file. Use a unique file name that will help you identify your uncertainty budget later on. I recommend keeping it simple and naming your file, “uncertainty-budget-template.xlsx.”
You will not understand how important this step is until you need to find your file again.
It is really frustrating when you are not able to find your uncertainty budgets during an ISO/IEC 17025 audit.
To take it a step further, I recommend that you create a unique file architecture system for your computers and servers. This will save you plenty of headaches over the course of your lifetime.
3. Create a table for your uncertainty calculations
In this step, create a table that you will use to perform uncertainty calculations. This will become your uncertainty budget.
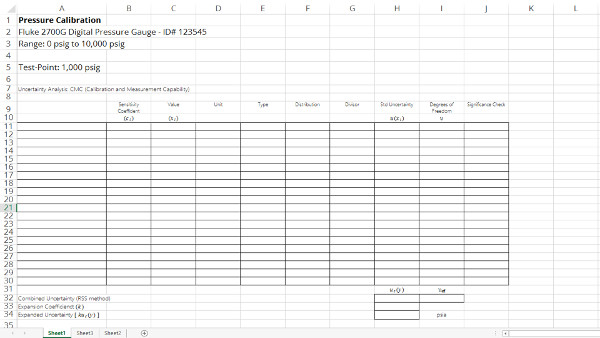
When developing your table, make sure to include the following parameters;
• Uncertainty Sources or Components
• Sensitivity Coefficients
• Uncertainty Values
• Units of Measure
• Probability Distributions
• Divisors
• Standard Uncertainty
• Degrees of Freedom
• Significance or Influence on Total Combined Uncertainty
• Combined Uncertainty
• Total Effective Degrees of Freedom
• Coverage Factor
• Expanded Uncertainty
• Notes, References, and Comments
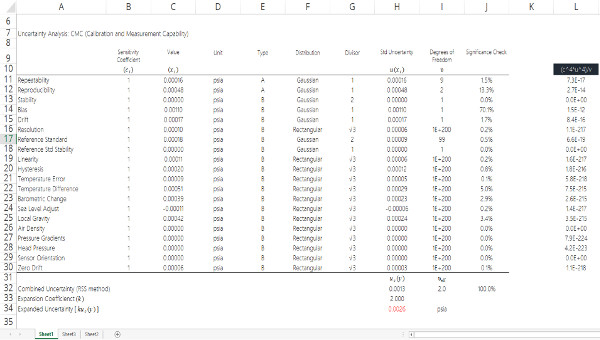
In my uncertainty budgets, I like to use rows to list my sources of uncertainty and columns to define the parameters of each uncertainty source.
Refer to the image below for an example.
However, fell free to use any type of format that you wish. You want to make sure that you and your assessors are able to understand your uncertainty budgets and calculations.
It is always best to be consistent. So, choose a format that works best for you and stick to it. Remember, you are the one who has to defend it.
4. Add functions to calculate uncertainty
Now that you have created a table for your uncertainty budgets, you will want to add functions and formulas to help you calculate uncertainty.
The benefit to adding formulas and functions is to add automation to your process for estimating uncertainty. Your uncertainty budget will become a calculator that will automatically calculate uncertainty based on your input values.
The five functions that I recommend you add are;
• Calculate standard uncertainty,
• Calculate combined uncertainty,
• Calculate expanded uncertainty,
• Calculate effective degrees of freedom, and
• Calculate the significance of your uncertainty components
Calculate Standard Uncertainty
Calculating standard uncertainty is pretty easy to do, and you can add this function to your uncertainty calculator in no time.
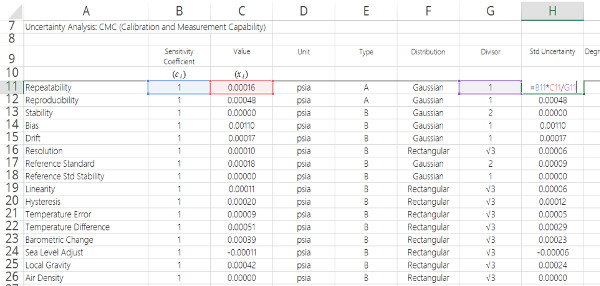
All you need to do is multiply the value of your uncertainty component by it’s respective sensitivity coefficient and divide it by it’s respective divisor (which is based on the probability distribution assigned to the uncertainty component).
To calculate standard uncertainty, follow these simple steps;
1. Select the standard uncertainty cell,
2. Press the equals (=) key to start a new function,
3. Select the sensitivity coefficient cell,
4. Type the asterisk(*) key (i.e. Shift+8) for the multiplication function,
5. Select the Uncertainty Value cell,
6. Type the forward-slash (/) key for the division function,
7. Select the Divisor cell,
8. Hit the ‘Enter’ key.
If you followed the steps above, your formula should look similar to the image below and your uncertainty budget calculator will now calculate standard uncertainty.
Calculate Combined Uncertainty
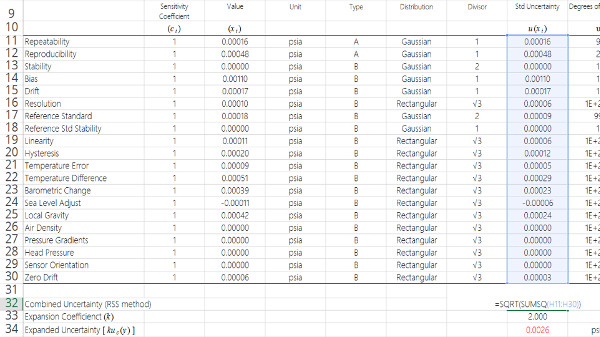
To calculate combined uncertainty, you will need to use the Root Sum of Square method as directed by the Guide to the Expression of Uncertainty in Measurement (i.e. GUM).
Over the years I have seen people perform this calculation in Excel the hard way by creating a very long formula to square each uncertainty component and add them together.
Well, I am going to show you the easy way to calculate combined uncertainty with just two Excel functions;
• sum of squares (i.e. SUMSQ), and
• square root (i.e. SQRT).
All you need to do is follow these simple steps;
1. Select the combined uncertainty cell,
2. Press the equals (=) key to start a new function,
3. Type the square root function (i.e. SQRT),
4. Press the open parenthesis key (i.e. Shift+9),
5. Inside the SQRT parenthesis, type the sum of squares function (i.e. SUMSQ),
6. Press the open parenthesis key (i.e. Shift+9),
7. Inside the SUMSQ parenthesis, select or type in the range of values,
8. Press the close parenthesis key (i.e. Shift+0) twice, and
9. Hit the ‘Enter’ key.
If you followed the steps above, your formula should look similar to the image below and your uncertainty budget calculator will now calculate combined uncertainty.
Calculate Expanded Uncertainty
The last step to estimating uncertainty in measurement is to calculate the expanded uncertainty.
This is where you multiply your combined uncertainty by a coverage factor (i.e. expansion coefficient) to achieve a desired confidence interval.
Typically, most people aim to calculate uncertainty with a 95% confidence level. To accomplish this, you will want to use a coverage factor of 1.96 (i.e. 95%) or 2 (i.e. 95.45%).
If you wish to use a different coverage factor, you can learn about choosing a coverage factor here.
To calculate expanded uncertainty, follow these simple steps;
1. Select the expanded uncertainty cell,
2. Press the equals(=) key to start a new function,
3. Select the coverage factor cell,
4. Type the asterisk(*) key (i.e. Shift+8) for the multiplication function,
5. Select the combined uncertainty cell, and
6. Hit the ‘Enter’ key.
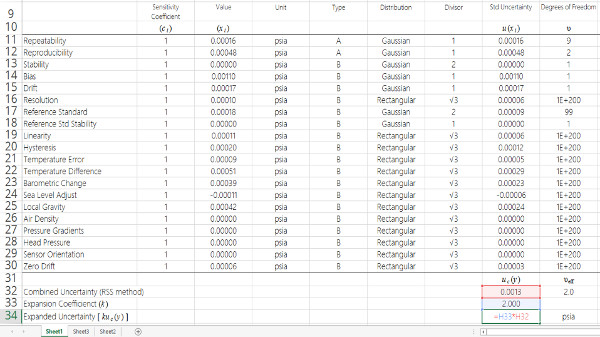
Your function should look similar to the example in the image below. Now, your uncertainty budget should calculate the expanded uncertainty automatically.
If you do not care to calculate effective degrees of freedom or the significance each uncertainty component contributes to the total combined uncertainty, you can skip the next two sections.
However, if you would like to have these functions in your uncertainty budget, keep reading. I am going to show you how, step by step.
Calculate Effective Degrees of Freedom
To calculate the effective degrees of freedom, you will need to use the Welch-Satterthwaite approximation equation.
However, calculating this value in a single cell requires a very long string of functions that can cause you plenty of headaches if you have errors or need to update the function.
For many years, I used to perform this calculation in a single cell which required me to constantly update the function every time I wanted to add or delete a row from my uncertainty budget.
The worst part is most the function had to be entered by hand. It was time consuming.
So, I decided to split the function into sub-functions to help minimize the level of effort required to calculate effective degrees of freedom.
First, I calculate the first half of the equation in each row associated with it’s respective source of uncertainty. This allowed to me to perform a majority of the calculations with a simple function that I could copy and paste.
To calculate the first half of the Welch-Satterthwaite equation, follow these simple steps;
1. Select a cell in the same row as the first uncertainty component,
2. Press the equals(=) key to start a new function,
3. Press the open parenthesis key (i.e. Shift+9) twice,
4. Select the sensitivity coefficient cell,
5. Raise it to the power of 4 by pressing the carrot key (i.e. Shift+6) and 4,
6. Press the close parenthesis key (i.e. Shift+0),
7. Type the asterisk(*) key (i.e. Shift+8) for the multiplication function,
8. Press the open parenthesis key (i.e. Shift+9),
9. Select the standard uncertainty cell,
10. Raise it to the power of 4 by pressing the carrot key (i.e. Shift+6) and 4,
11. Press the close parenthesis key (i.e. Shift+0) twice,
12. Press the forward slash key ( / ) for the divide function,
13. Select the degrees of freedom cell,
14. Hit the ‘Enter’ key.
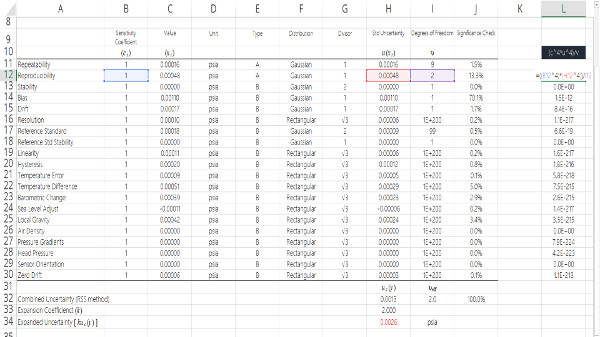
If you followed the steps listed above then your function look similar to the example in the image below.
Next, double check the function to make sure that it performs a calculation and that there are no errors. Then, copy the cell and paste the function for each additional source of uncertainty in your uncertainty budget.
Now, let’s add the second half of the equation to your uncertainty budget and calculate effective degrees of freedom.
To calculate the last half of the Welch-Satterthwaite equation, follow these simple steps;
1. Select the cell designated for effective degrees of freedom,
2. Press the equals(=) key to start a new function,
3. Press the open parenthesis key (i.e. Shift+9),
4. Select the combined uncertainty cell,
5. Raise it to the power of 4 by pressing the carrot key (i.e. Shift+6) and 4,
6. Press the close parenthesis key (i.e. Shift+0),
7. Press the forward slash key ( / ) for the divide function,
8. Press the open parenthesis key (i.e. Shift+9),
9. Type ‘SUM’ for the summation function,
10. Press the open parenthesis key (i.e. Shift+9),
11. Select the range of cells for the first half of the Welch-Satterthwaite equation,
12. Press the close parenthesis key (i.e. Shift+0) twice,
13. Hit the ‘Enter’ key.
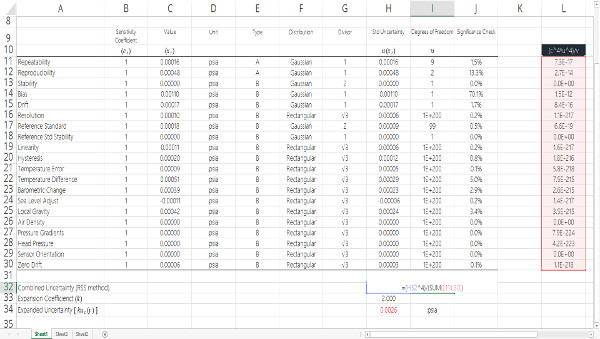
If you followed the steps listed above then your function look similar to the example in the image below, and your result will be the calculation of effective degrees of freedom.
Calculate Significance for Each Uncertainty Component
Knowing the significance or the amount of influence each source of uncertainty has on your measurement results is important.
Calculating significance can show you;
• how much each source contributes to the total uncertainty,
• which factors have the greatest influence, and
• help you reduce your estimated measurement uncertainty.
When you know which uncertainty components contribute the most, you can take action to target and reduce the magnitude of the largest contributors.
This approach will have the biggest impact and help you improve your CMC Uncertainty estimates.
To calculate the significance of each source of uncertainty, follow these simple steps;
1. Select a cell in the same row as the first uncertainty component,
2. Press the equals(=) key to start a new function,
3. Select the standard uncertainty cell for that row,
4. Raise it to the power of 2 by pressing the carrot key (i.e. Shift+6) and 2,
5. Press the forward slash key ( / ) for the divide function,
6. Type ‘SUMSQ’ for the sum of squares function,
7. Press the open parenthesis key (i.e. Shift+9),
8. Select the range of cells for standard uncertainty,
9. Press the F4 key once to fix these reference cells (should add $ symbols to the formula),
10. Press the close parenthesis key (i.e. Shift+0),
11. Hit the ‘Enter’ key.
Now, copy and paste this function for each uncertainty component in your uncertainty budget. Then, format the values to display as percentages (%).
If you followed the steps listed above then your function look similar to the example in the image below.
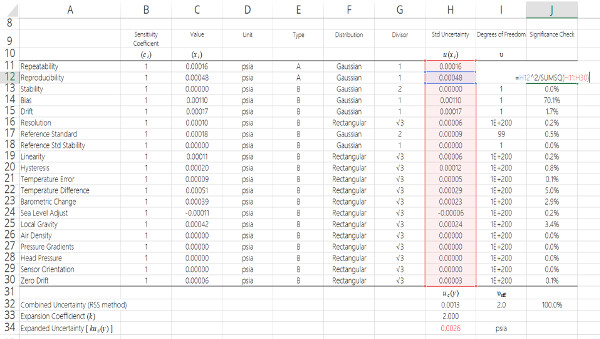
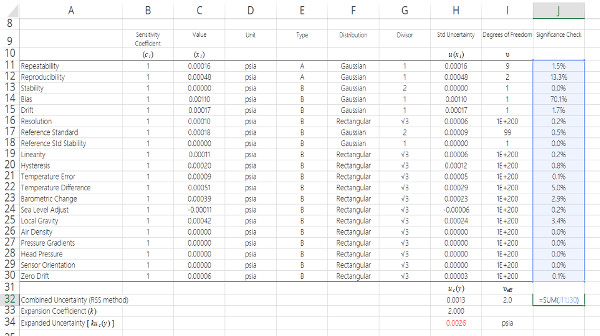
Additionally, the sum of all the significance calculations should equal 100%. This is a great way to verify that calculations are correct.
To check, follow the steps below to calculate the sum of all of your significance calculations;
1. Select a cell in the same column as the significance calculations,
2. Press the equals(=) key to start a new function,
3. Type ‘SUM’ for the summation function,
4. Press the open parenthesis key (i.e. Shift+9),
5. Select the range of cells for significance,
6. Press the close parenthesis key (i.e. Shift+0),
7. Hit the ‘Enter’ key.
If you followed the steps listed above then your function look similar to the example in the image below and the summation value should equal 100%. If not, something was miscalculated and you should double check your functions to find the error.
5. Add a section for notes
By now, you should have a functional uncertainty calculator that can be used to create uncertainty budgets for ISO/IEC 17025 accreditation.
However, you need add a section for notes.
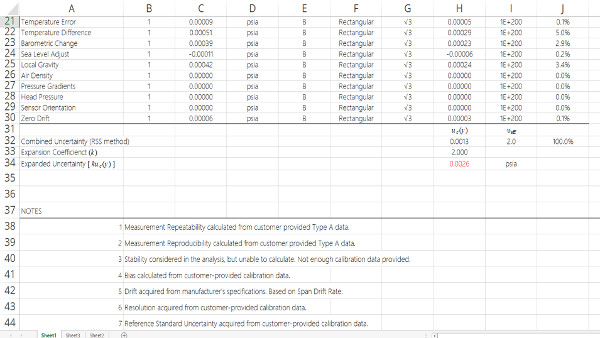
Adding notes to your uncertainty budgets is important. It will help you and your assessor better understand how you estimated uncertainty in measurement.
You should add notes to explain;
1. How you identified your sources of uncertainty,
2. How you quantified them,
3. What reference material (e.g. reports, books, guides, etc.) was used, and
4. Other important information that supports your estimate.
Most people forget to add notes to their uncertainty budgets which is a big mistake.
You may remember how you estimated uncertainty in measurement today, but it is harder to recall the details several months later when you need to explain the results to an auditor or update your calculations.
To avoid headaches and audit deficiencies, make sure that you are recording notes. I promise that you will thank me later.
6. Test your calculator and verify it works
This is important for validation. It’s not just for your own sanity, it helps when assessors question whether or not you have validated your uncertainty calculator.
Some assessors like to assert that it is required as part of validation of software. However, it is not.
You are not creating measurement uncertainty software. Instead, you are using Microsoft Excel as a calculator. No different than a scientific or graphing calculator.
However, this does not mean that you should not validate that your uncertainty budget calculator works properly.
So, try one of more of these methods to verify that your uncertainty budget calculates measurement uncertainty correctly. Compare your results to;
1. hand-written uncertainty calculations,
2. calculations performed with a scientific or graphing calculator,
3. measurement uncertainty software,
4. another Excel uncertainty calculator, and(or)
5. results estimated by a third-party.
Any of the methods listed above should help you validate that your uncertainty budget calculator works correctly.
If your comparison yields similar results, consider your uncertainty budget to function properly. If not, review your functions for errors. Then, correct the errors and repeat the verification process.
Once you verify that your uncertainty budget calculates measurement uncertainty correctly, it is safe to use for developing your scope of accreditation.
Conclusion
Uncertainty budgets are a useful tool for estimating uncertainty. They will help you clearly explain how you calculated uncertainty in measurement.
The number one thing to remember is to include enough information that you can easily recall how you calculated uncertainty and repeat the process when you need to update your estimates.
In this guide, I have given you step by step instructions to create your own uncertainty budgets in Microsoft Excel. Use the information to help you calculate uncertainty for ISO/IEC 17025 accreditation.
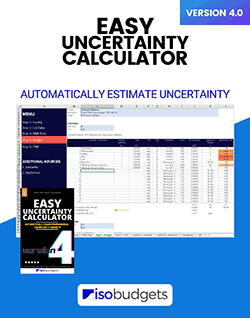
If you want an uncertainty budget template but don’t want to build it yourself, try my uncertainty calculator for Excel. You can get it for only $29 and download it now.
Leave a comment below if you find this guide helpful, and let me know if you have any questions.

9 Comments