Introduction
Calculating measurement uncertainty is not easy. In fact, I speak with people every day who are having problems with estimating uncertainty. Therefore, I put together this guide to share my exclusive seven step process to calculating measurement uncertainty.
In this guide, you will learn how to calculate measurement uncertainty in seven easy steps. Also, you will learn what information you need to calculate uncertainty, how to identify contributors to uncertainty, and how to evaluate your calculations to prevent overestimating or underestimating uncertainty. Furthermore, I will share with you some of my exclusive tips to help you calculate uncertainty like a pro.
Now, this guide is not a complete “how to” manual. Nor, will it answer all of your questions. Instead, it should be used as a quick reference guide to simplify the uncertainty estimation process into seven steps and learn some of the personnel secrets I use to calculate uncertainty.
So, read this guide and use my advice to help you calculate uncertainty. If you have questions, make sure to contact me. Additionally, feel free to use this guide to help you write an uncertainty procedure for your laboratory.
To calculate measurement uncertainty you follow a 7-step process: (1) Specify the measurement process and equation, (2) Identify sources of uncertainty, (3) Quantify those sources, (4) Characterise each source (Type A/Type B, probability distribution), (5) Convert all uncertainty components to standard deviation equivalents, (6) Calculate the combined standard uncertainty (RSS method), (7) Calculate the expanded uncertainty (select coverage factor, multiply) and finally (8) evaluate the budget for appropriateness.
TL;DR
• Determine the requirements to estimate uncertainty (step 1)
• List all possible sources of uncertainty (step 2)
• Evaluate each source of uncertainty (step 3)
• Characterize uncertainties by type & distribution (step 4)
• Convert uncertainties to standard deviations (step 5)
• Combine uncertainty using the root-sum-of-squares method (step 6)
• Expand uncertainty to 95 % confidence with a coverage factor (step 7)
Why it matters
A robust uncertainty estimate is required for compliance with ISO/IEC 17025:2017 section 7.6, and influences measurement decisions, risk assessments, reporting, and accreditation scopes. By using a structured 7-step approach you reduce under- or over-estimating your measurement capability, improve transparency, and build confidence with assessors and customers.
What you’ll get
This guide walks you through each step in detail, gives you actionable tasks (“what to do”), questions to ask, examples of typical sources (repeatability, drift, bias, etc), and links to deeper resources/calculators/tools to help you implement it in your lab.
Get a PDF version of this guide free!
How to Calculate Uncertainty in 7 Steps
Estimating measurement uncertainty can be a difficult task. Especially, since most measurement uncertainty guides do not give you a process or procedure.
Therefore, I developed a seven-step process that you can use every time you estimate measurement uncertainty. Just follow the steps below to when you need to create an uncertainty budget.
Step 1. Specify the Measurement Process and Equation
1.1 Create a Plan to Estimate Uncertainty
When calculating measurement uncertainty, it is best to have a plan. So, the first step to estimating uncertainty is to specify the measurement process.
This step focuses on determining the requirements for the uncertainty analysis, so you can focus your attention on evaluating the right information and data.
Without requirements, you are likely to make mistakes.
Therefore, you need to document:
- A clear statement of what is being measured and the measurand,
- Any formulas (with input quantities) needed to calculate the result,
- The method or procedure that will be used,
- The equipment needed,
- The performance criteria (e.g. Measurement range)
- The results (within the measurement range) to estimate uncertainty.
After documenting these requirements, you are ready proceed to Step 2: Identifying Sources of Uncertainty.
In the sections below, you will find more detailed guidance to help you determine these requirements.
1.2 How to Specify the Measurement Process
In this section, I am going to give you step-by-step instructions for specifying the measurement process.
To specify the measurement process, follow the instructions below:
- Select the test or measurement function to evaluate.
- Determine the test method or measurement procedure to be used.
- Determine the equipment and(or) reference materials that will be used.
- If applicable, determine the measurement range or range of possible outcomes.
- Determine the test-points or expected results to evaluate.
- Whenever possible, identify the mathematical formulas associated with the measurement function.
1.3 Specifying the Measurement Function for a Calibration Lab
If you are a calibration laboratory, this process is typically easy.
- Determine what you are calibrating,
- Determine what method or procedure you use to perform calibration,
- Determine the equipment used to perform calibration,
- Determine the measurement range of the equipment,
- Determine the test-point(s) for estimating uncertainty, and
- If possible, find the mathematical formula associated with the measurement process.
1.3.1 Determine the Measurement Function, Method, and Equipment
For example, imagine your laboratory calibrates torque wrenches by comparison to a reference transducer in accordance with ISO 6789.
With this information, we can specify the first three requirements:
- What are you calibrating: Torque Wrenches
- What method: ISO 6789
- What equipment: Reference transducer with an indicator and mechanical loader
1.3.2 Determine the Measurement Range
Next, investigate the capabilities of the equipment to determine its recommended range of measurement performance.
- Measurement Range: (25 to 250) Nm
1.3.3 Determine the Test Points to Evaluate
Now, determine if you plan to use the equipment’s full measurement range to calibrate equipment. If so, select test-points that effectively cover the measurement range.
For our example, I will pick test-points at 10% and 100% of the measurement range.
- Test Point 1: 25 Nm
- Test Point 2: 250 Nm
I selected these test points because they:
- fully cover the intended range of use, and
- coincide with the equipment’s calibration records.
Typically, I recommend selecting at least two points across the measurement range.
- Select one point near the minimum of the measurement range, and
- Select one point near the maximum of the measurement range.
You can select more test-points if desired or required. Some test methods require you to estimate uncertainty at several points along the measurement range you so can develop an accurate linear predication model to estimate uncertainty.
When selecting test-points, it helps to review your equipment’s calibration report. You should pick values associated with the equipment’s calibration because you will need the calibration data later to evaluate uncertainties. This will ensure a more accurate estimate measurement uncertainty.
Also, avoid selecting test-points that do not cover the intended range of use. Most assessors will:
- cite a nonconformity for extrapolation, or
- limit the measurement range in your scope of accreditation.
1.3.4 Determine Measurement Function/Formula
Now, review the calibration procedure to find any formulas associated with the calibration process. If the procedure does not include any formulas, you can look in a physics textbook or any measurement-specific guidance documents.
With the formula(s), you can find many of the significant contributors to uncertainty in the equation. So, I recommend documenting any formulas related to your measurement type or process. You can use it later to evaluate uncertainty.
My favorite method for evaluating uncertainty, with a formula, is a one factor at a time (OFAT) analysis. It allow you to propagate individual uncertainty contributors through the measurement process to see how it affects the results.
It is great for:
- evaluating uncertainty contributors one at a time,
- determining sensitivity coefficients.
However, if your measurement process is known to have interactions but any of the input quantities, then you should use a Factorial Experiment. It allows to evaluate multiple sources of uncertainty and their interactions at the same time.
Plus, you can use the results to determine sensitivity coefficients and build measurement models that can help you optimize your measurement process to minimize uncertainty.
For example, the calibration method (ISO 6789) does not specify a formula for the calibration process. However, you can look in a physics textbook to find the Torque or Moment of Force equation.
This formula can be expanded to evaluate other uncertainties, such as:
- thermal expansion due to temperature,
- force loading point distance from the fulcrum, or
- angular misalignments in the applied force.
1.3.5 Summary: Specifying the Measurement Function (Calibration Lab)
Finally, summarize the requirements specified in this process.
- What are you calibrating: Torque Wrenches
- What method: ISO 6789
- What equipment: Reference transducer with an indicator and mechanical loader
- Measurement Range: (25 to 250) Nm
- Test Points to Evaluate Uncertainty:
- Test Point 1: 25 Nm
- Test Point 2: 250 Nm
- Measurement Equation/Formula: Mi = ri ∙ Fi ∙ sinθ
Since the requirements for the uncertainty analysis have been determined, we can proceed to the next step of the process; Step 2: Identifying Sources of Uncertainty.
1.4 Specifying the Measurement Function for a Test Lab
If you are a test laboratory, this process can be a bit challenging. There are many variables that can make specifying the measurement function confusing (I will explain these later).
Below, you will find general outline of the process.
- Determine the test item,
- Determine the test method,
- Determine the equipment, materials, and reagents used to perform testing,
- Determine the performance characteristics of the test,
- Determine the test results (outcomes) to evaluate, and
- If possible, find the mathematical formula(s) associated with the method.
1.4.1 Determine the Test Item
First, you need to determine what is being tested. This is typically an item or a sample of an item.
1.4.2 Determine the Test Method
Next, determine the method that will be used to perform the testing.
- Chemical Composition Tests – For chemical concentration measurements (e.g. HPLC, ICP-MS, PCR, and similar), estimate uncertainty per EURACHEM CG-4 or ISO 20395. If you need to estimate uncertainty for balances, thermometers, pH meters, titrators, etc, then this guide will work for you.
- Microbiology Tests – For colony counting and enumeration methods, estimate uncertainty per ISO 19036, ISO 21748, or A2LA G108. For qPCR and dPCR methods, estimate uncertainty per ISO 20395. If you need to estimate uncertainty for balances, thermometers, pipettes, pH meters, moisture analyzers, etc, then this guide will work for you.
- Reference Materials – For reference material producers, estimate uncertainty per ISO 33405 (formerly ISO Guide 35). This guide will not work for you. However, portions of this guide may be helpful for evaluating the characterization uncertainty.
Now, you must consider that a test method can be collection of multiple test methods that:
- test different aspects of the test item, or
- must be performed in series to get to the final test result.
This can make this part of the process difficult and confusing.
1.4.2.1 Simple Test Methods
If your test method is a simple process, you can move on to determine the next requirement. Otherwise, read the information below to learn how to handle complex test methods.
1.4.2.2 Methods that Test Different Characteristics of a Test Item
If your test method includes a group of tests, then you must select only one of these tests to estimate uncertainty. Once you complete the first uncertainty analysis, then you can repeat this process for each additional testing activity.
This means that one test method may require more than one uncertainty analysis.
1.4.2.3 Methods with a Sequence of Multiple Tests
If your test method includes a series of tests and(or) measurements that must be performed to get to the final test result, then you may need to perform more than one uncertainty analysis.
Typically, you will need to estimate uncertainty for each stage or measurement of the test process and use the results to estimate uncertainty in the next or final stage of the process.
1.4.3 Determine the Test Equipment and Reference Materials
After you determine what test method, or portion of a test method, to evaluate measurement uncertainty, determine what equipment and(or) reference materials are needed to perform the test.
If applicable, include reagents the evaluation. Sometimes, their characteristics may impact test results and must be evaluated as a contributor to measurement uncertainty.
Next, review the method and the required equipment, materials, and reagents to determine whether or not they:
- perform quantitative measurements,
- provide quantitative reference values, and(or)
- impact test results.
Ultimately, if equipment, reference materials, and(or) reagents impact test results, they should be considered in the uncertainty analysis.
1.4.4 Determine the Performance Characteristics of the Test
Now, you must determine the capabilities, or the range of possible outcomes, associated with the test. ISO/IEC 17025:2017, section 7.2.2.3 refers to this as the performance characteristics of the method.
Sometimes, this is easy. If you routinely perform the test, you likely know the minimum and maximum results that can or have been achieved based on prior evidence or experience.
Other times, this is not easy. If you have never performed the test before or rarely conduct the test, then knowing the range of possible outcomes is difficult. You may have to conduct experiments or perform research to determine what is possible.
In either case, you must determine the limitations of your testing activities. This information will be need to evaluate uncertainty.
1.4.5 Determine the Results (Outcomes) to Evaluate
Next, determine the test-points or expected outcomes to evaluate as part of your uncertainty analysis.
Not all tests have test-points. However, based on experience with your testing activities, you should know the range of possible outcomes or results associated with the test.
With this information, you will want to estimate uncertainty for various outcomes that cover the range of possible outcomes.
Therefore, determine requirements you can control to produce consistent, repeatable results that cover the range of possible outcomes (i.e. maximum and minimum).
You will evaluate uncertainty at these points.
1.4.6 Find Formulas Associated With Your Test Method
Finally, review the test method and find any formulas associated with the test method. If the method does not include any formulas because they are considered common knowledge, still document the formulas. They can be used to help estimate uncertainty.
With the formula(s), you can identify many of the significant contributors to uncertainty that affect test results.
Also, you can use the formulas to conduct a one factor at a time (OFAT) analysis. This is one of my favorite methods for propagating uncertainty through the formula to estimate uncertainty in the test result. Plus, you can use this method help you determine sensitivity coefficients to convert uncertainties into the same unit of measurement as the result.
However, if there are interactions between the sources of uncertainty known to be significant contributors, then you will want to consider robust testing with a factorial experiment. This is my preferred method for estimating uncertainty in this scenario.
1.5 Summary and Example of Specifying the Measurement Process
To summarize this section, perform the steps below to establish the requirements for your uncertainty analysis. Then, document your requirements to make sure your evaluations of measurement uncertainty meet these requirements.
- Determine the test or measurement process to evaluate.
- Whenever possible, find any formulas (with input quantities) needed to calculate the result.
- Determine the test method or calibration procedure used to get the results.
- Determine the equipment and(or) reference materials needed to get results.
- Determine the performance characteristics associated with the process.
- Determine the test-points or results to estimate uncertainty.
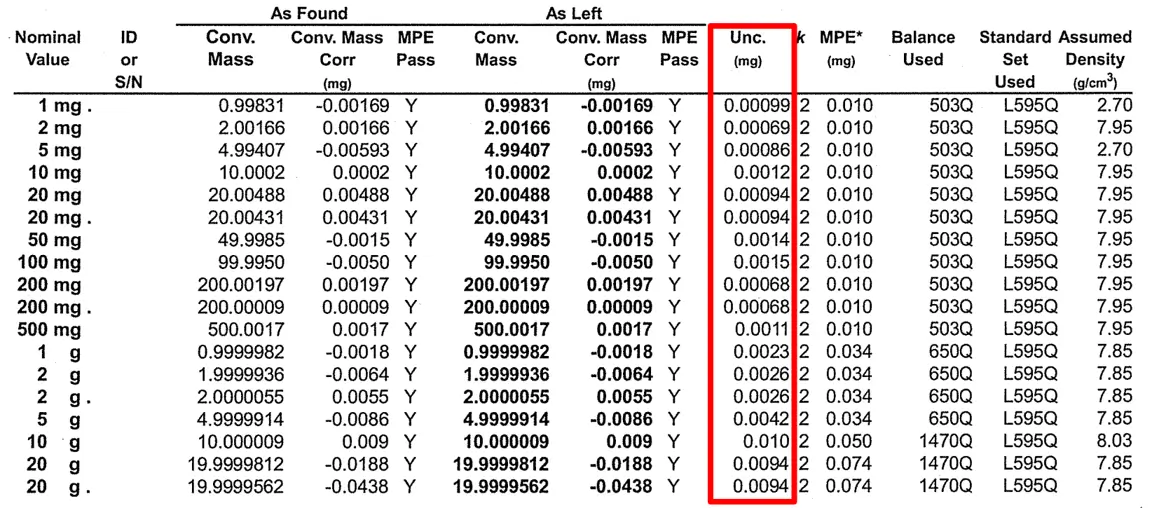
In the image below, you will see an example of these requirements documented in one of our uncertainty budgets. I marked up the image to show how these requirements were documented.
- 1 – Measurement Process
- 2 – Calibration Method
- 3 – Measurement Equipment
- 4 – Performance Characteristics: Measurement Range
- 5 – Test-Point
- 6 – Formula associated with the process
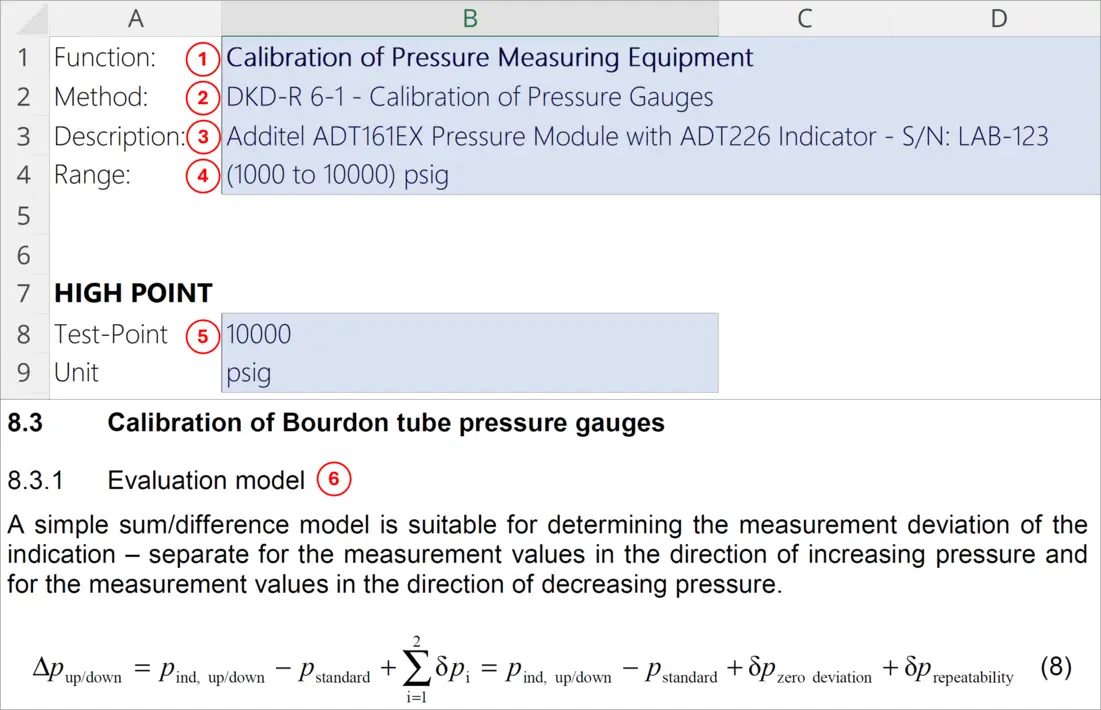
In addition to the formula given in the above image, pressure can also be evaluated using the following formulas:
- Pressure Formula: Fluid/Gas Density and Height
- Pressure via Ideal Gas Law Formula
- Pressure Formula: Force over Applied Area
Each one of these formulas, while not directly related to the measurement process, can be used to evaluate significant contributors to measurement uncertainty. Hence, the reason to find formulas associated with your measurand.
Step 2: Identify the Uncertainty Sources
Now that you have determined the test or measurement process that you are going to evaluate, you need to identify the factors that influence uncertainty in measurement results.
Typically, this process is not easy and can be very frustrating. So, stay calm, be patient, and keep researching. You may be surprised by how many influences can affect your measurement results.
2.1 Finding Sources of Uncertainty
Finding sources of uncertainty can be difficult. It requires a lot of time and effort to conduct research. It is the most time-consuming process when evaluating measurement uncertainty.
Based on my experience, finding factors that influence uncertainty typically requires 50% of the time you spend estimating uncertainty. In the image below, you will see a graph I created that shows how you will typically spend your time estimating uncertainty.
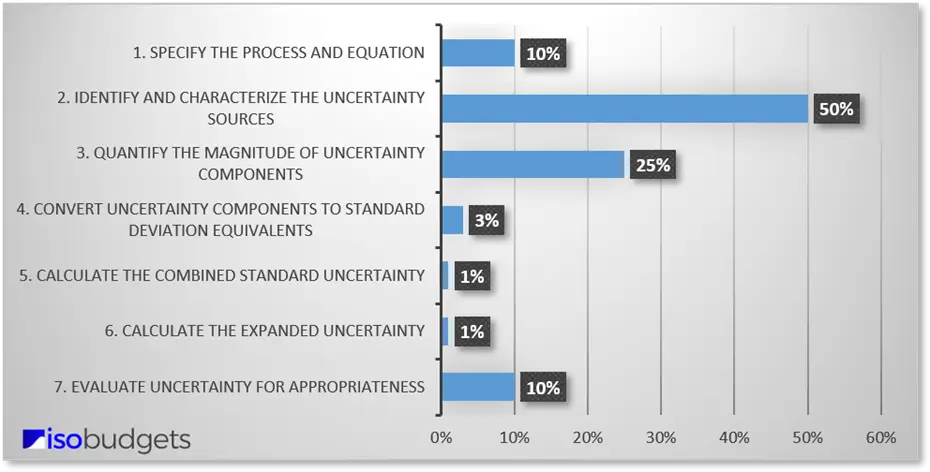
However, if you spend time evaluating your process and conducting research, you should be able identify several sources of uncertainty for your analysis. Afterward, make a list of the contributors so you can quantify them later.
2.2 How to Find Sources of Uncertainty
To find sources of uncertainty for your analysis, follow steps listed below:
- Evaluate the test method, calibration procedure, or measurement process.
- If applicable, evaluate the measurement equations.
- Evaluate the equipment, reference standards, and(or) reference materials.
- Evaluate the environmental conditions and any other potential influences.
- Identify the minimum required sources of uncertainty.
- Research various sources of information.
- If necessary, consult an expert.
- Document the findings in your uncertainty budget.
2.3 Best Places to Find Sources of Uncertainty
When you need to find sources of uncertainty, it helps to have a list of available resources. Resources can speed up the process of finding contributors to uncertainty and even show you how to evaluate each uncertainty component.
You should create a repository of your resources so you can quickly access them when updating uncertainty budgets or finding evidence to support your uncertainty analysis. A simple file folder system or database can help you keep these resources organized.
Below is a list of places, including links, that you can use to help you find sources of uncertainty.
- Standard Methods
- Reputable Technical Organization Documents
- Manufacture and Producer Documents
- Journals and Conference Papers
- Textbooks
- Other Uncertainty Budgets
- PT/ILC Reports
2.3.1 Standard Methods & Publications
Next, consider using standard methods published by ASTM, ISO, IEC, IEE, BS, etc. Many standard methods provide information about estimating uncertainty. This can be very helpful, and I highly recommend these documents.
- ASTM – American Society for Testing and Materials
- ISO – International Organization for Standardization
- IEC – International Electrotechnical Commission
- IEEE – Institute of Electrical and Electronics Engineers
- BSI – British Standards
- DIN – Deutsches Institut für Normung
2.3.2 Guides from Reputable Organizations
If you do not want to pay for standard methods, consider using free resources from reputable organizations or national metrology institutes (NMI). Many of these documents are full of information that will help you estimate uncertainty, sometimes with step-by-step instructions.
- OIML Guides
- EURAMET Calibration Guides
- EURACHEM Guides
- NPL Measurement Good Practice Guides
- NIST Special Publications
- NIST Internal Reports
- NIST Handbooks
- PTB Deutscher Kalibrierdienst (German Calibration Service) Guides
- BIPM Publications
- MSL Technical Guides
- Accreditation Body Guides
Note: Some standard methods are based on some of these documents
2.3.3 Equipment Manufacturer and RM Producer Information
Manufacturer information can be extremely useful when estimating uncertainty. Many reputable manufacturers provide an abundance of information about their products that can help you find sources of uncertainty. Some even publish guides and white papers that will show you how to estimate uncertainty for their products.
Where available, manufacturer documents can be one of the best places to find uncertainty contributors. Below, you will find a list of OEM documents you should always check.
- Manufacturer Manuals
- Manufacturer Datasheets
- Manufacturer Calibration Reports
- RM Producer Certificates of Analysis
- RM Information Sheets
- Material Safety Datasheets (MSDS)
- White Papers
- Technical Notes & Guides
2.3.4 Journals and Conference Papers
Journals and conferences are a great place to find detailed information about estimating uncertainty. Industry professionals publish and(or) present the results of their research. Some of these include how they evaluated uncertainty for a specific test or measurement.
As a result, their research can benefit you with information and evidence to support your uncertainty analysis. Below, you will find a list of journals and conference proceedings.
- Metrologia
- IMEKO – International Measurement Confederation
- NIST Journal of Research
- CalLab Magazine
- NCLSI Measure Magazine
- Conference Papers
- Conference PowerPoint Presentations
- CIPM Proceedings
2.3.5 Textbooks
When estimating uncertainty, I always recommend finding a book or guide on the measurement process you are evaluating. Physics, Chemistry, and Engineering textbooks can come in handy for understanding background and detailed information about your test or measurement process.
Plus, textbooks include formulas, reference tables, and other information that can be critical to estimating uncertainty.
2.3.6 Uncertainty Budgets and PT/ILC Reports
Finally, if you are lucky, you may be able to get uncertainty budgets, proficiency test reports, and(or) interlaboratory comparison reports. These documents can give you plenty of information to help you estimate uncertainty.
Uncertainty budgets from NMIs and reputable labs can make estimating uncertainty much easier. They will show you what uncertainty contributors to evaluate and expanded measurement uncertainty so you can compare the results of your uncertainty analysis.
PT/ILC reports typically help you evaluate whether your expanded uncertainty is too small or too large. However, ILC reports published by EURAMET typically include the uncertainty budgets from the participating national labs. Similarly, they can show you what sources of uncertainty to evaluate.
Below is a list of resources you can use to find sources of uncertainty.
- Uncertainty Budgets from other labs
- PT/ILC Reports
- BIPM Committees
- EURAMET Research Projects
2.4 Find Sources of Uncertainty in Measurement Equations
Measurement equations are great for estimating uncertainty. Each variable in the equation is a source of uncertainty.
This is why you should buy textbooks and standard methods, so you can get access to formulas for your testing or measurement processes.
This will make finding the contributors to uncertainty much easier. To quantify the sources of uncertainty, I typically use a one factor at a time analysis or a factorial experiment design to propagate uncertainty to see how it affects the result.
2.4.1 Measurement Functions with Equations
For example, if you are evaluating the calibration of a torque transducer, then find the measurement equation. Below, you will see the basic moment of force (i.e. torque) equation where a force is applied at a specific angle (typically 90 °) at a specific distance from the fulcrum point (i.e. radius).
You can find this equation in any physics textbook.
![]()
M = Moment of Force (i.e. Torque)
r = radius from the center of the fulcrum
F = Force applied
θ = Theta or the angle of applied force
However, this is not the full equation used to calibrate a torque transducer. After further review of EURAMET CG-4 and several OEM calibration procedures, the full formula to calibrate a torque transducer is found below.
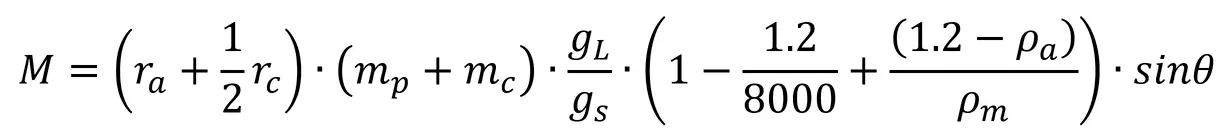
M = Moment of Force (i.e. Torque)
ra = radius of the torque wheel/arm
rc = radius of the cable
mp = conventional mass of the weight pan
mc = conventional mass of the applied weights
gL = local gravity
gs = standard gravity (9.80665 m/s2)
ρa = Density of moist air
ρm = Density of reference weights
θ = the angle of applied force
When you further evaluate the equation, you begin to account for other factors that influence the equation. In this example, we begin to consider the following as contributors to measurement uncertainty:
- radius of the torque arm and cable,
- mass of the weights and pan,
- local gravity,
- magnitude of air buoyancy correction, and
- angle of applied force.
Additionally, you will need to evaluate the thermal linear expansion of the torque arm and cable; and, any other source of uncertainty determined to significantly impact measurement results.
This is why finding formulas and equations related to your testing or measurement process is helpful. They give insight into the uncertainty components you should evaluate and include in your uncertainty budgets.
While this process seems easy, it can be difficult depending on the complexity of the equation. Knowing the rules for the propagation of uncertainty can come in handy in the next step.
Otherwise, you can perform a one-factor at a time analysis or full-factorial experiment to help you evaluate uncertainty. These are two of my favorite evaluation methods and I highly recommend them.
2.4.2 Measurement Functions without Equations
Many tests and measurement functions do not have equations. So, you will need to evaluate the measurement process to find the factors that influence measurement uncertainty.
2.5 Categorizing Sources of Uncertainty
Start by evaluating the core elements of the measurement process, including the:
- Method,
- Equipment (including Reference Materials),
- Personnel,
- Environment,
- Unit Under Test, and
- Post-Treatment of Results
If you evaluate these categories, you will find sources of uncertainty that influence measurement results.
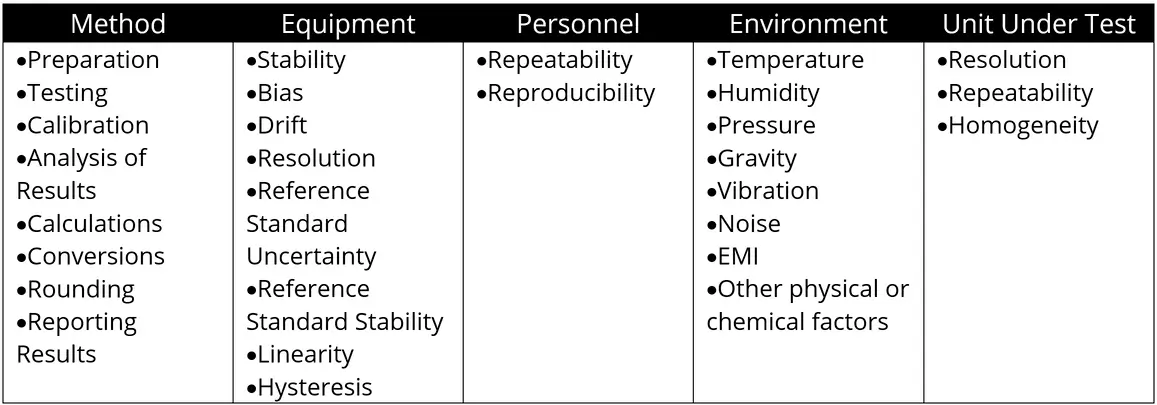
Look at the table below. It categorizes sources of uncertainty into 5 core groups. In each group (column), you will find a list of related uncertainty contributors.
You can use this table to get ideas of potential contributors to evaluate in your uncertainty analysis. Otherwise, make a blank copy of this table and use it to record any contributors you find while researching your measurement process.
Segmenting your process into these categories, makes it easier to find sources of uncertainty.
2.6 Tips for Finding Sources of Uncertainty
Next, I made a list of useful tips that can help you find contributors to measurement uncertainty.
- Read the test or measurement procedure and look for risks to measurement uncertainty.
- Review equipment and reference material certificates and specifications. Look for information that impacts measurement results, such as repeatability, reproducibility, drift, bias, resolution, reference standard uncertainty, thermal coefficients, calibration coefficients, etc.
- Watch personnel perform the test or measurement and identify factors that may affect results.
- Review the environmental conditions where tests or measurements are performed and look for potential risks to measurement results.
- Examine the item or unit under test. If necessary, conduct research to find more information about the items tested or calibrated. Look for factors that can affect measurement uncertainty.
- Conduct research to find guides, papers, journal articles, training presentations, etc. that contain information to help you perform an uncertainty analysis.
When you do not have a method that outlines how to evaluate uncertainty or an equation related to the measurement process, you must conduct research to estimate measurement uncertainty. Use the tips given above to find contributors to uncertainty.
Sometimes, you may get lucky and find a paper or guide with a cause and effect (a.k.a. fishbone) diagram or an uncertainty budget with information applicable to your uncertainty analysis. However, this is not common.
So, you will most likely need to conduct research to find sources of uncertainty.
To learn more about finding sources of measurement uncertainty, check out this guide:
Step 3. Quantify the Magnitude of Uncertainty Components
Before calculating measurement uncertainty, you must first determine the magnitude of each contributing factor. To accomplish this, you may need to perform some data reduction and analysis.
3.1 How to Quantify Uncertainty
To quantify uncertainty, you need to follow the four steps below:
- Collect Information and Data
- Evaluate and Select the Right Data
- Analyze the Data
- Quantify Uncertainty Components
3.1.1 Collect Information and Data
To get started, you need to collect information and data related to your uncertainty analysis. You should have found most of this information in Step 2.
Look at the list below and gather the following items. You will need them to quantify sources of uncertainty.
- Last 2 or more equipment Calibration Reports,
- If applicable, a recent Certificate of Analysis,
- Results of Repeatability and Reproducibility (R&R) Studies,
- A copy of the Method or Procedure,
- Manufacturer Manuals and Specification Sheets,
- Technical Documents and Guides,
- Published Papers, Studies, Journal Articles, etc.
- If applicable, in-house Experiment Results.
With the items in the list above, you should be able determine how much uncertainty is contributed from each source. If you need help, you can contact me for additional guidance or hire me to analyze the data for you.
3.1.2 Evaluate Information and Select the Right Data
Next, you need to evaluate the information to find the data you will use for estimating uncertainty. Look for information and data related to your uncertainty analysis and disregard everything else from consideration.
This should include information and data related to your:
- measurement function,
- measurement range, and
- test-point or expected results.
I receive a lot of feedback from testing labs that claim “We don’t have test-points.” While this is generally true, you typically know the capabilities (e.g. minimum and maximum) and expected outcomes of your testing activities.
Therefore, set-up your evaluations based on the expected outcomes near the range limits (i.e. minimum and maximum) of your testing capabilities.
3.1.3 Analyze the Data
Then, analyze your data using appropriate methods of analysis to find the magnitude of each uncertainty component. You can analyze data in many ways, so choose techniques that are suitable for the data you are analyzing.
If you need help, get a quality statistics textbook or check out the free NIST SEMATECH Engineering Statistics Handbook. You can also look at some of my guides on quantifying sources of uncertainty.
Below, is a textbook I recommend on Statistical Quality Control. I have a version of this book from grad school that I still use today. It is a great book and it is referenced in several ISO methods and industry documents.
3.1.4 Quantify Uncertainty Components
Finally, use your data to quantify each uncertainty component and add the results to your uncertainty budget or uncertainty calculator.
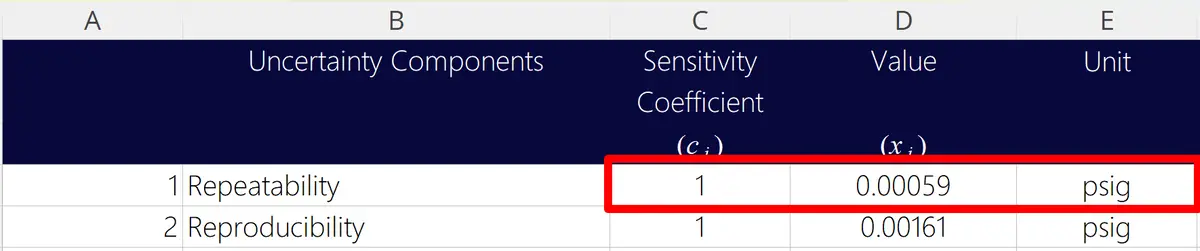
3.1.4.1 Uncertainties in the Same Unit of Measurement
Add the uncertainty and associated unit of measurement directly into your uncertainty budget. Keep the sensitivity coefficient at one (1).
A lot of people ask me, “Why is the sensitivity coefficient equal to one?”
I tell them, “An uncertainty reported in the same unit of measurement as the result is an absolute uncertainty. It does not need to be converted to a different unit of measurement, so keep the sensitivity coefficient at one (1).”
Any number multiplied by one will stay the same value. Therefore, when the uncertainty is multiplied by a sensitivity coefficient of one, the value of the uncertainty in your budget will remain the same.
3.1.4.2 Uncertainties in the Different Units of Measurement
However, if your uncertainty is in a different unit of measurement than the result, then you will need to:
- convert the uncertainty (to the same unit of measurement) or
- use a sensitivity coefficient.
You can add an uncertainty with a different unit of measurement to your budget; but, you need to use a sensitivity coefficient to convert the uncertainty to a value in the same unit of measurement as your result.
Otherwise, your estimated expanded uncertainty will be incorrect.
I see this all of the time. People mix different units of measurement in their uncertainty budgets and get expanded uncertainties that are too large or too small.
Using a sensitivity coefficient solves this problem.
For example, I see people add temperature uncertainties to their uncertainty budgets in degrees Celsius even though their measurement result is a different unit of measurement. The best way to handle this uncertainty is to:
- use a sensitivity coefficient, or
- convert the uncertainty to a value in the same unit of measurement.

3.1.4.3 Relative Uncertainties
Another option is the use of relative uncertainties. This is where you convert your uncertainty into a term relative to the results, such as a:
- percentage (%) or
- parts-per-million equivalent (parts in 106 or µUnit/Unit)
Many people prefer to use relative uncertainties compared to using sensitivity coefficients. Therefore, this has become a popular option for evaluating uncertainty.
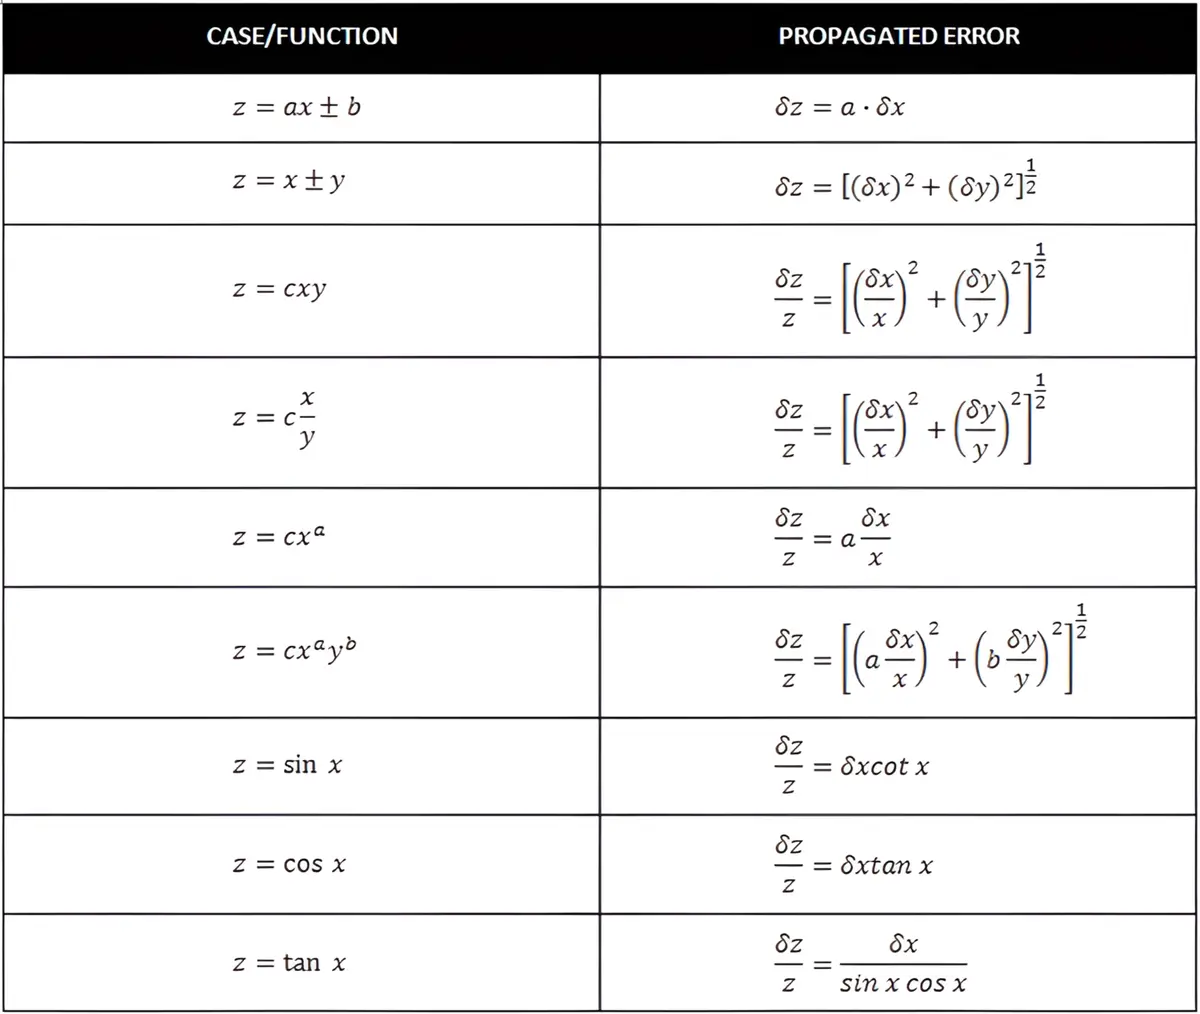
However, you must be careful! Using relative uncertainties for specific measurement functions can cause significant errors in estimating uncertainty. You have to know the rules for propagating uncertainty.
In the table below, you will see the rules for propagating uncertainty based on the measurement function.
3.1.4.4 Keeping Notes and Evidence
When evaluating uncertainty contributors, there are a variety of statistical techniques you can use. Just make sure you are able to explain how you quantified the uncertainty components.
If necessary, make sure you have evidence to support your evaluations. It is becoming a trend that assessors are asking for more evidence (than they used to) to validate your uncertainty estimates.
I recommend adding detailed notes to your uncertainty budgets. Your notes should include the following information:
- how you estimated uncertainty,
- where the data came from, and
- any documents that support your evaluations.
Detailed notes will help you remember how you estimated uncertainty the next time:
- an auditor asks questions about your uncertainty calculations, or
- you update your uncertainty budgets.
In the image below, you will see an example of some of the notes I include in my uncertainty budgets.
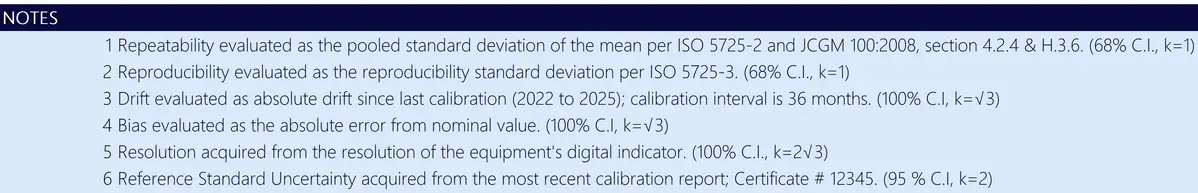
3.2 Evaluate Sources of Uncertainty
In this section, I will show you a list of common sources of uncertainty that should be included in every uncertainty budget. Many of these factors are required by section 4.6.1 of the A2LA R205 document.
While this is not a requirement for every accredited lab, I like their list of minimum required uncertainty contributors. Therefore, I have decided to use them in each one of my uncertainty analyses.
However, I typically include more sources of uncertainty in my budgets. Below, I have made a list of the minimum sources of uncertainty to include in every uncertainty budget.
- Repeatability
- Reproducibility
- Stability or Drift
- Bias
- Resolution
- Reference Standard Uncertainty
- Environmental Factors
- Method or Measurement-Specific Uncertainties
3.2.1 Repeatability
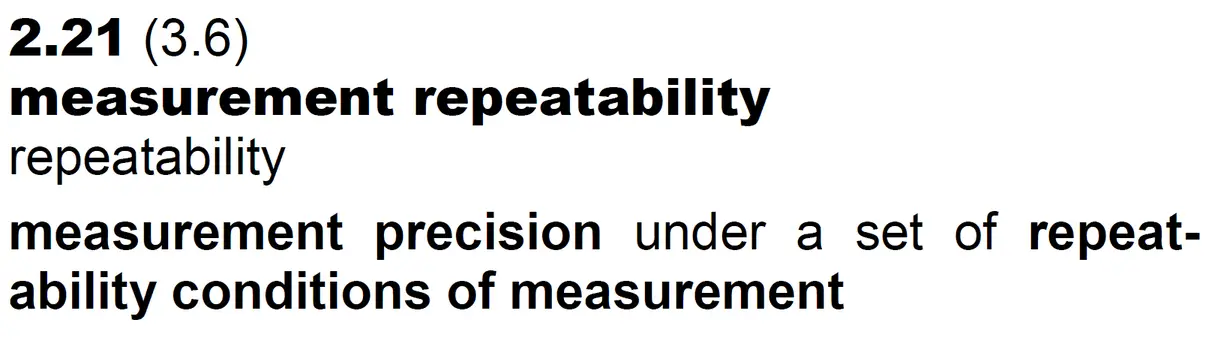
Repeatability is an evaluation of the variability in your measurement results under similar conditions, such as:
- Same operators/technicians,
- Same days,
- Same methods,
- Same measuring systems,
- Same environmental conditions, and(or)
- Same locations.
It can be evaluated using one of the following techniques:
- Standard deviation – for a single sample set,
- Pooled standard deviation – for more than one sample set, and
- Standard deviation of the mean – for averaged results
Refer to the following documents to evaluate repeatability:
- Calculate repeatability for a single sample set
- Calculate repeatability for multiple sample sets
- Calculate standard deviation of the mean
Refer to the following documents to calculate the pooled standard deviation:
- ISO 5725-2: method for the determination of repeatability and reproducibility of a standard measurement method, and
- JCGM 100:2008, sections 4.2.4 and H.3.6
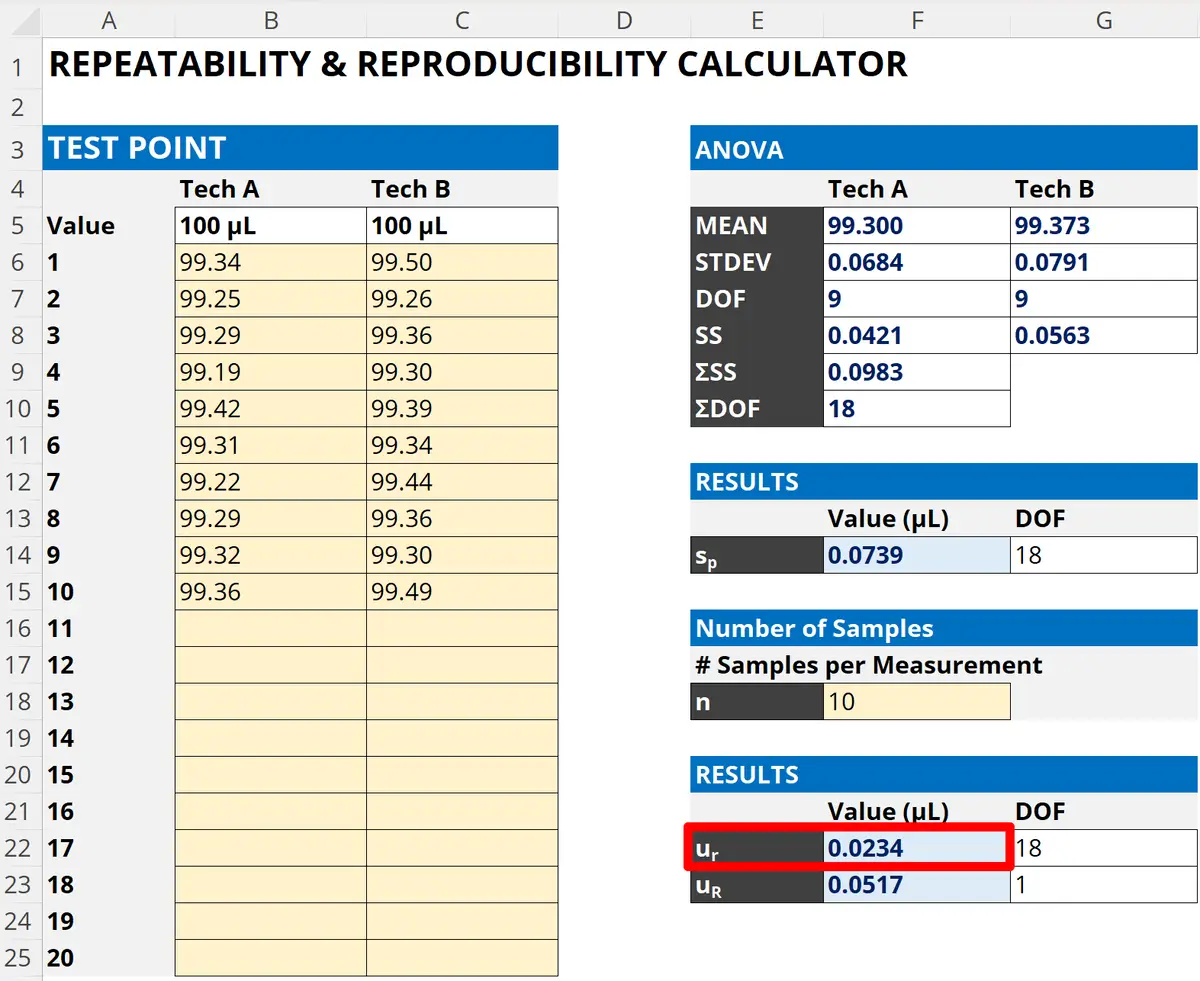
3.2.1.1 How to Calculate Repeatability
Follow the instructions below to calculate repeatability:
- Repeat a test or measurement ‘n’ number of times.
- Record the result of each test or measurement.
- Calculate the standard deviation of the recorded results.
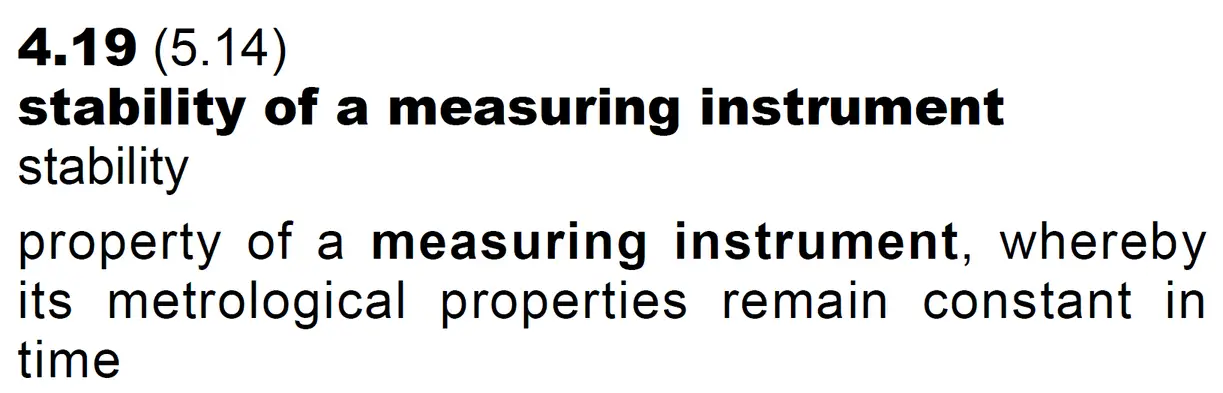
3.2.2 Reproducibility
Reproducibility is an evaluation of the variability in your measurement results under different conditions, such as:
- Different operators/technicians,
- Different days,
- Different methods,
- Different measuring systems,
- Different environmental conditions, and(or)
- Different locations.
It can be evaluated using one of the following techniques:
- Intermediate Precision Standard deviation – per ISO 5725-3,
- Reproducibility Standard deviation – per ISO 5725-2,
- Range of Variation – see ISO 376 or ISO 6789.
Learn how to calculate reproducibility (step-by-step) using the methods listed above. Just click the links below:

3.2.2.1 How to Calculate Reproducibility (Intermediate Precision)
Follow the instructions below to calculate reproducibility per ISO 5725-3:
- Perform a Repeatability Test.
- Calculate the mean (i.e. average) of the results.
- Change one variable.
- Perform another Repeatability Test (with the new condition).
- Calculate the mean (i.e. average) of the results.
- Calculate the standard deviation of the test means.
To calculate reproducibility (step-by-step) using the methods listed above, click the links below:
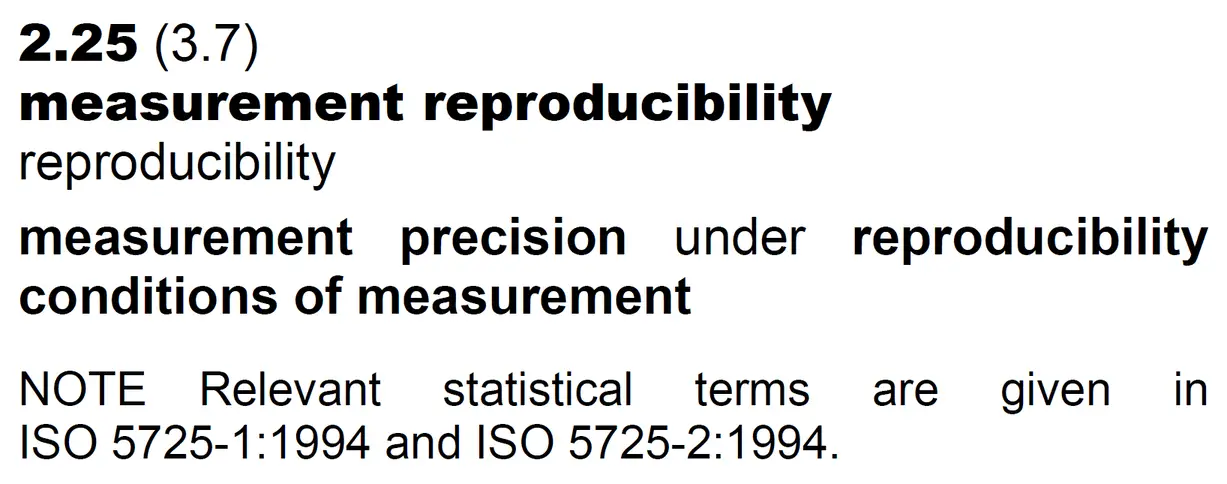
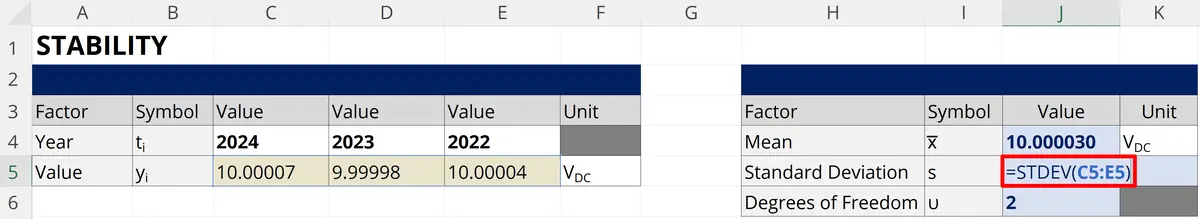
3.2.3 Stability
Stability (or instability) is an evaluation of the variability in your measurement process over time.
It can be evaluated using one of the following techniques:
- Stability standard deviation – per NIST Sematech,
- Slope uncertainty – per ISO 33405,
- Drift – see section on Drift.
In the image below, you will see long-term stability evaluated as a standard deviation in an Microsoft Excel stability calculator.
3.2.3.1 How to Calculate Stability
Follow these instructions to calculate long-term stability as a standard deviation:
- Review your last 3 calibration reports.
- Record the results from each calibration report.
- Calculate the standard deviation of the calibration results.
3.2.3.2 More Information about Stability
For more information about calculating stability, check out the below list of resources.
- How to Calculate Stability for Uncertainty- ISOBudgets
- NIST SEMATECH, Section 2.4.4.3
- ISO 34405, Section 8
- ISO 22514-2
- ISO 22514-7
3.2.4 Bias
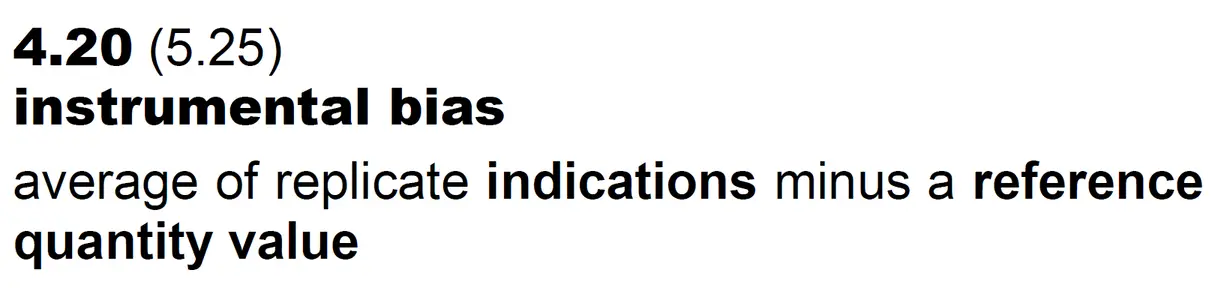
Bias is an evaluation of the systematic error in your measurement process.
It can be evaluated as the difference between a measured or predicted value and the actual (i.e. reference) value using one of the following techniques:
- Systematic/Bias Error – Deviation from a reference value.
- Linearity Error – Difference (i.e. residual error) between the actual value and predicted value of a linear (straight-line) model.
- Interpolation (Curve Fit) Error – Average difference (i.e. standard error of the estimate) between the actual value and predicted value for a regression model or polynomial function.
Be careful to only include one of these errors in your uncertainty budget. Otherwise, you will overstate the estimated uncertainty due to double-counting. Refer to JCGM 100:2008, section 4.3.10.
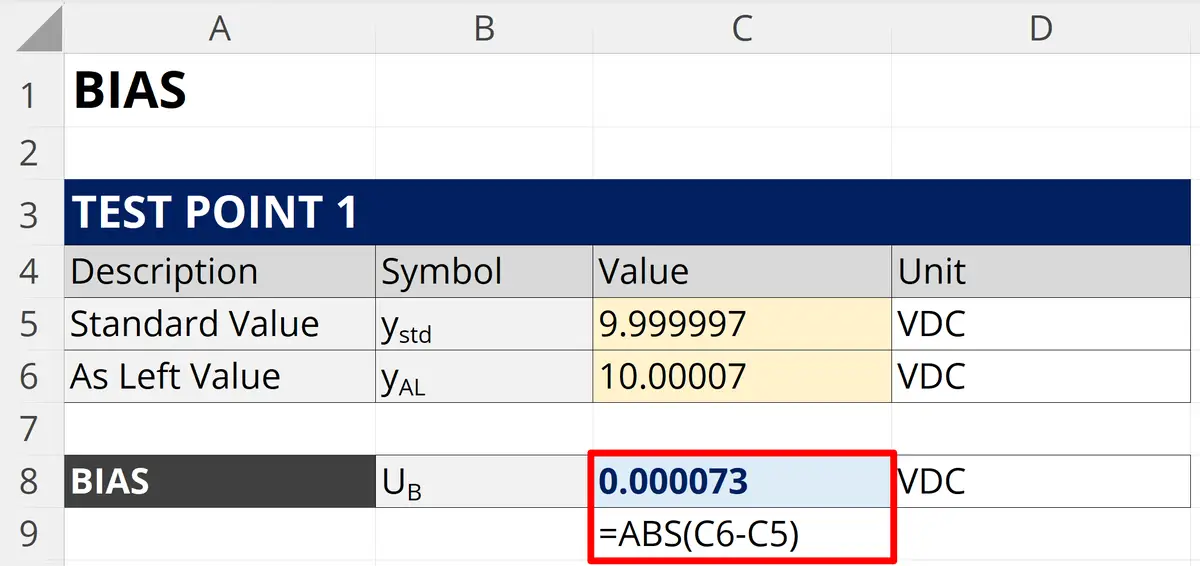
3.2.4.1 How to Calculate Bias
Follow these instructions to calculate bias:
- Review your most recent calibration report.
- Find the As Left value or measurement result.
- Find the Nominal, Standard, or Reference value.
- Calculate the absolute difference (i.e. deviation).
3.2.5 Drift
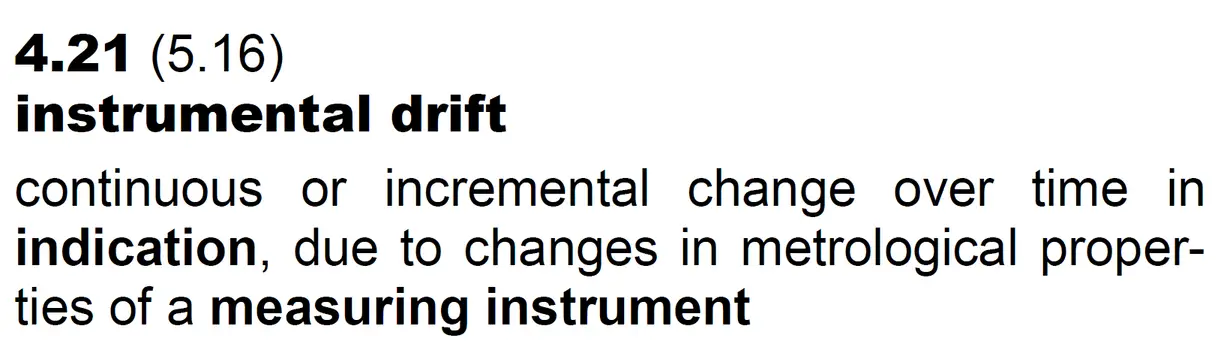
Drift is an evaluation of the systematic change in your measurement process or system over time.
It can be evaluated using one of the following techniques:
- Accuracy, Maximum Permissible Error, etc. – Specification limits acquired from the manufacturer datasheet and(or) manuals.
- Tolerance Limits – Half-interval of the upper and lower tolerance limits given in a calibration report or certificate of analysis.
- Drift Since Last Calibration – Difference between the last two calibrations.
- Average Drift Over Time – Average difference over a series of calibrations.
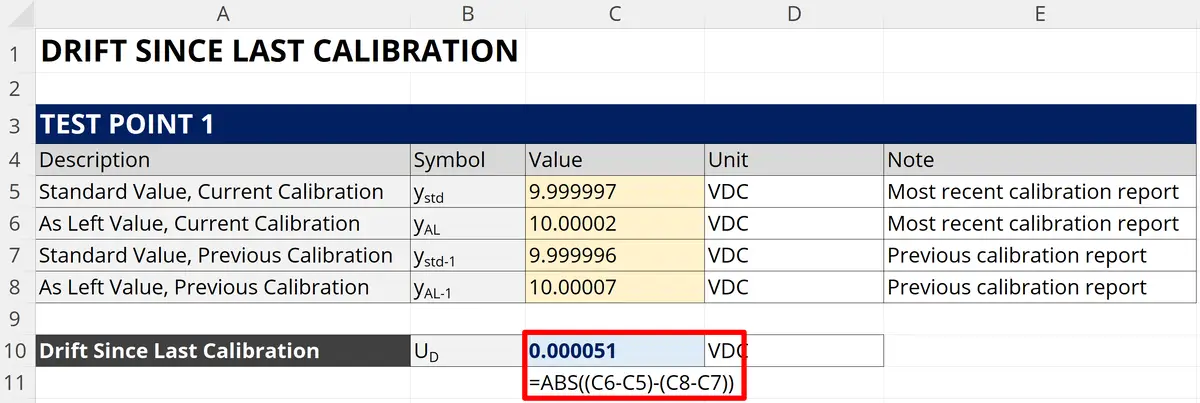
3.2.5.1 How to Calculate Drift Since Last Calibration
Follow these instructions to calculate drift since last calibration:
- Review your last 2 calibration reports.
- Find the values of interest.
- Record the results from each calibration report.
- Calculate the difference between the current and previous results.
- Convert the result to an absolute value.
3.2.6 Resolution
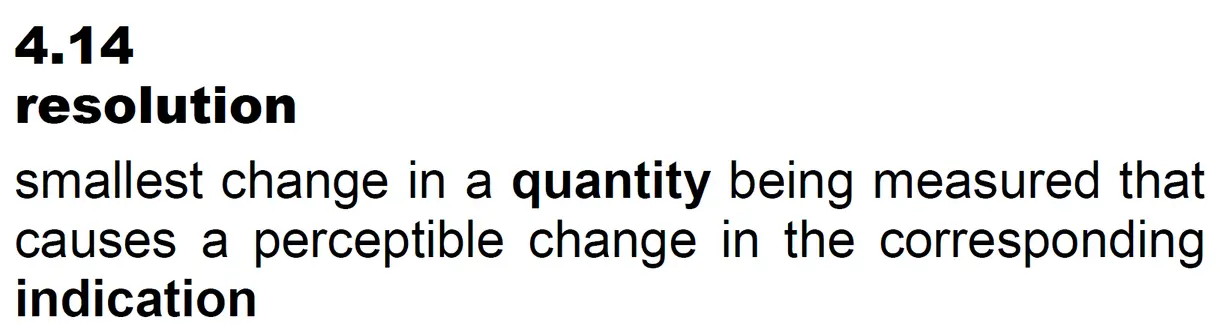
Resolution is an evaluation of the smallest incremental change observed in your measurement process or system.
It can be evaluated using one of the following techniques:
- Full Resolution – 100 % of the incremental change or scale resolution.
- Half Resolution – 50 % of the incremental change or scale resolution.
- Fractional Resolution – fractional value of the incremental change or scale resolution (e.g. 1/5 to 1/2 of the scale increment per ISO 6789).
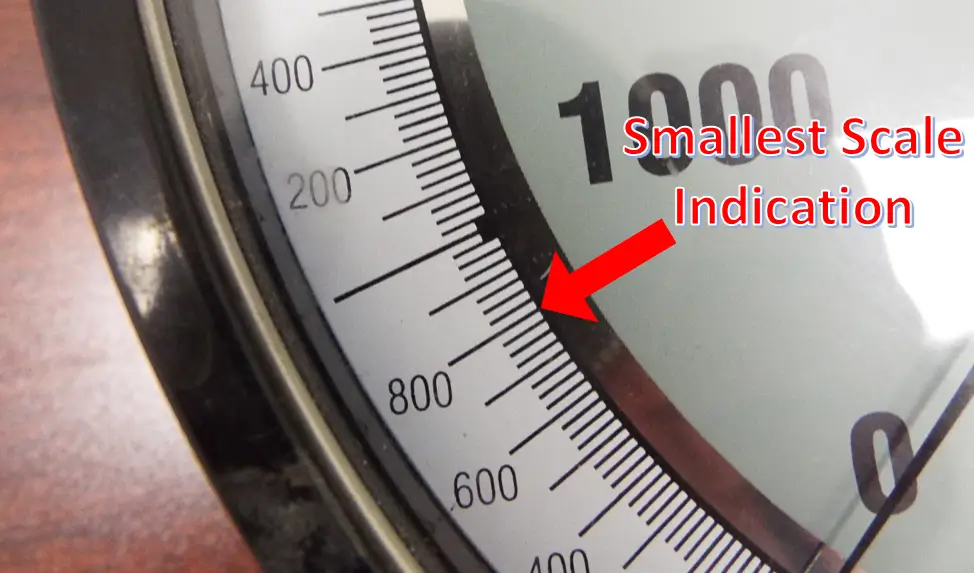
3.2.6.1 How to Determine the Resolution Uncertainty
Follow these instructions to evaluate resolution uncertainty:
- Look at your measurement system or equipment indicator or scale.
- Find the least significant digit or scale increment.
- Determine the smallest incremental change.
- Evaluate the resolution using of the following techniques:
- Full resolution,
- Half resolution, or
- Fractional resolution.
3.2.7 Reference Standard Uncertainty
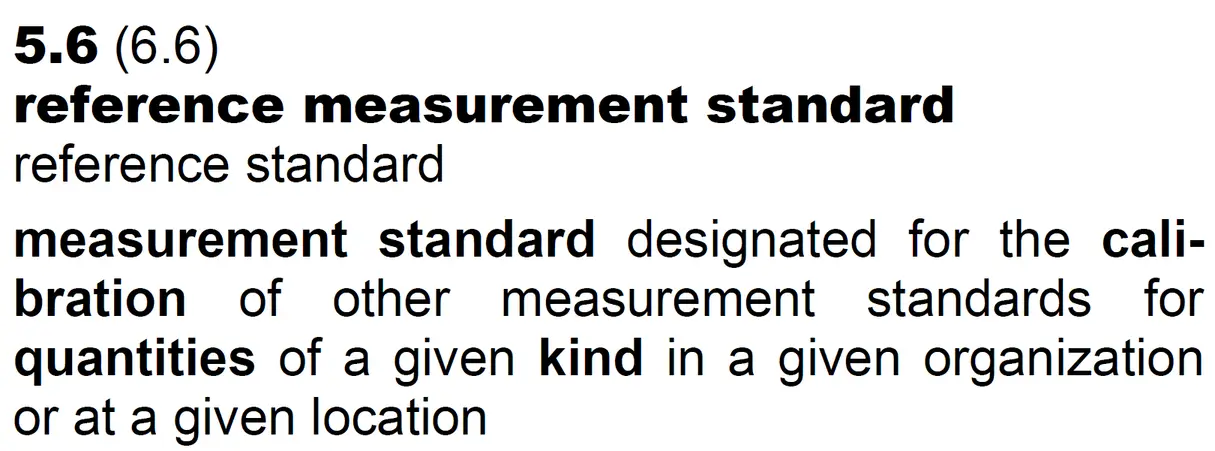
Reference Standard Uncertainty is the uncertainty associated with metrological traceability that links a calibrated quantity (i.e. measurement result) to an appropriate reference standard.
It can be found in your:
- calibration reports, and(or)
- certificates of analysis.
3.2.7.1 How to Find Reference Standard Uncertainty
Follow these instructions to find the reference standard uncertainty:
- Review your latest calibration report or certificate of analysis.
- Find the results associated with your uncertainty analysis.
- Find the reported estimate of expanded measurement uncertainty associated with the result.
3.2.8 Environmental Uncertainty Contributors
Make sure to consider, evaluate, and include any environmental sources of uncertainty that can affect your test and measurement results.
Each measurement function can be uniquely impacted by environmental influences. This makes it difficult to give universally applicable methods to evaluate uncertainty.
Therefore, you will need to conduct research for your test of measurement function to:
- find significant contributors to measurement uncertainty, and
- how to evaluate them.
Below, you will find a list of the most common environmental sources of uncertainty:
- Temperature
- Relative Humidity
- Barometric Pressure
- Elevation/Altitude
- CO2 Absorption
- Local Gravity
- Evaporation
- Convection Effects
- Wind Drafts/Draughts
- Speed of Light
- Speed of Sound
- Refractive Index
- Noise
- Vibration
- Illuminance
- EMI/EMF
- Magnetism
- Dirt/Dust
- and more
This is not a full list. There are additional sources of uncertainty that may affect your measurement results.
3.2.9 Method-Specific Sources of Uncertainty
Make sure to read and review your test and calibration methods. Many of today’s standard methods (ISO, ASTM, etc.) include information to help you estimate uncertainty.
If your laboratory claims to follow a specific test or calibration method, then you need to make sure that your evaluation of uncertainty includes sources of uncertainty specified by the method. Otherwise, you are not conforming to the method and will likely get a nonconformity (deficiency) during your next assessment.
So, make sure to review your methods and include the contributors specified in your uncertainty budget.
3.2.10 Other Significant Contributors to Uncertainty
Make sure to include any other sources of uncertainty that significantly impact your test or measurement results.
Below, you will find a list of other common sources of uncertainty:
- Thermal Expansion
- Flatness
- Parallelism
- Cosine Error
- Abbe Error
- Deformation
- Geometric Errors
- Air Buoyancy
- Water Density
- Mass Density
- Eccentricity
- Reversibility
- Head Pressure
- Pressure Expansion
- Compressibility
- Emissivity
- Cold Junction Errors
- Stem Conduction
- Self-Heating
- Uniformity
- Thermal EMF
- Circuit Loading
- Reactance
- Frequency Response
- Impedance Mismatch
- And much more
3.3 What is Considered a Significant Contributor
According to A2LA R205, a significant contributor is considered a source of uncertainty that changes the CMC uncertainty by 5% or more.
In the image below, you will see an excerpt from the A2LA R205 that defines significant.

Significant contributor or significant change is not defined (to my knowledge) by any other organization. However, most accreditation bodies and assessors consider significant to mean a 5 to 10 % change in the CMC Uncertainty.
Therefore, make sure to include any significant contributors to measurement uncertainty in your uncertainty budget.
3.4 Avoid Double-Counting Uncertainty
The JCGM 100:2008, section 4.3.10 recommends avoiding double-counting uncertainty. Therefore, I made a list of notes below to help you avoid double-counting and overstating your expanded uncertainty.
- Stability and Drift: Evaluate stability or drift, but not both. Each of these contributors evaluates change over time. Including both in your budgets can cause overstating uncertainty.
- Bias and Stability or Drift: Evaluate bias only if drift or stability is based on actual data. Do not evaluate bias if it is based on accuracy or tolerance limits, except where bias exceeds these limits.
- Bias and Linearity: Evaluate bias or linearity, but not both. Many methods evaluate linearity as a maximum deviation. When this is true, including bias will overstate uncertainty.
- Bias or Linearity and Interpolation Error: Evaluating linearity or bias and calibration curve fit (i.e. interpolation error) can cause overstating uncertainty. These factors typically confound each other. Therefore, you must evaluate them further to separate their influence from each other. When they confound, remove the influence using the Root Square Deviation method. Otherwise, you will overstate uncertainty.
- Resolution and Repeatability: According to some standard methods, resolution may be included in the repeatability uncertainty which may allow you to omit resolution from the uncertainty budget. Additionally, the results of repeatability testing can be limited to the resolution of the equipment yielding results that are all the same (i.e. no variability). When this occurs, the JCGM 100:2008, section F.2.2.1 recommends evaluating the repeatability uncertainty as the resolution (d) divided by the square root of 12 (ur = d/√12 or 0.29∙d).
- Resolution and Reference Standard Uncertainty: According to the ILAC P14, uncertainties reported in calibration reports must include contributions from the unit under test (UUT), such as: UUT Resolution and UUT repeatability. Therefore, the resolution uncertainty of your equipment should already be included in the reference standard uncertainty.
Now, these are only a few scenarios where you can double-count uncertainty. There are plenty more.
Typically, these can be only found using experimentation to evaluate the interactions between sources of uncertainty. In these situations, I prefer to use a factorial experiments.
Use the information in this section to help you avoid double counting uncertainty. Otherwise, you will estimate uncertainties that are much larger than expected which can cause issues when determining the quality of your measurements and making statements of conformity.
3.5 ISOBudgets Guides for Evaluating Sources of Uncertainty
To learn more about sources of uncertainty and how to quantify them, check out these guides:
- 7 Sources of Uncertainty to include in Every Uncertainty Budget
- Repeatability Uncertainty
- Reproducibility Uncertainty
- Stability Uncertainty
- Drift Uncertainty
- Linearity Uncertainty
- Hysteresis Uncertainty
- Thermal Expansion Uncertainty
- Air Density Uncertainty
- Emissivity Uncertainty
- Local Gravity
- Air Buoyancy Uncertainty
Step 4. Characterize Sources of Uncertainty
Now that you identified and quantified your sources of uncertainty, your next step will be to characterize each factor by uncertainty type and probability distribution.
4.1 How to Characterize Sources of Uncertainty
To characterize your sources of uncertainty, perform the following tasks below:
- Categorize each source of uncertainty: Type A or Type B,
- Assign a probability distribution to each uncertainty component.
4.2 Uncertainty Types
The first step to characterizing your uncertainty components is to categorize them as either Type A or Type B. Read the sections below to learn the difference between Type A and Type B uncertainty.
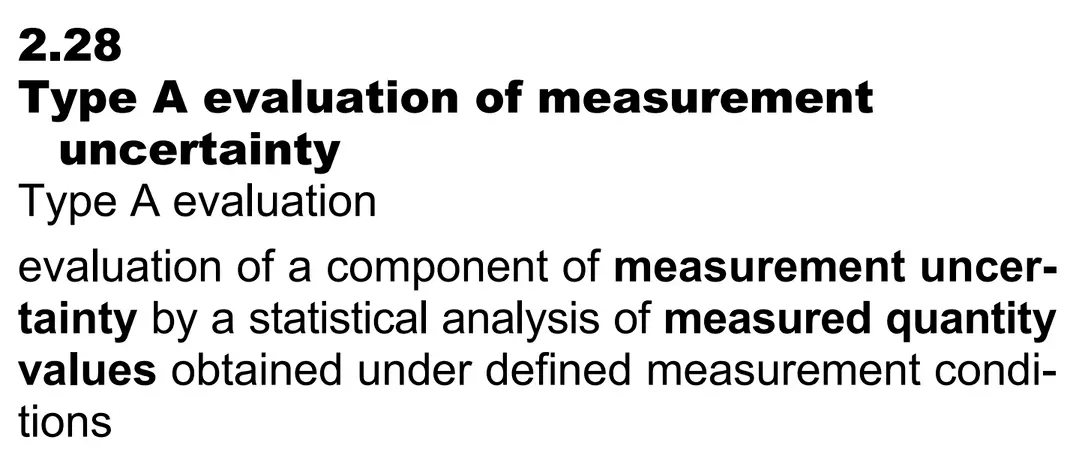
4.2.1 Type A Uncertainty
According to the Vocabulary in Metrology (VIM), Type A uncertainty is an “evaluation of a component of measurement uncertainty determined by a statistical analysis of measured quantity values obtained under defined measurement conditions.”
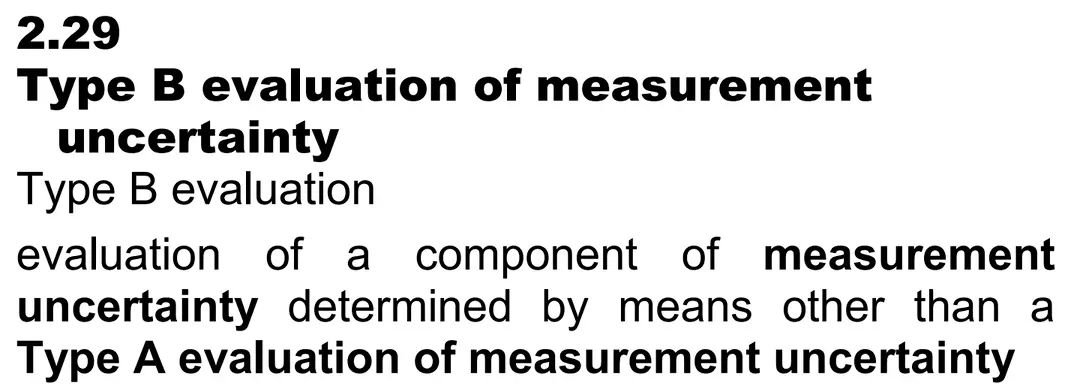
4.2.2 Type B Uncertainty
According to the Vocabulary in Metrology (VIM), Type B uncertainty is an “evaluation of a component of measurement uncertainty determined by means other than a Type A evaluation of measurement uncertainty.”
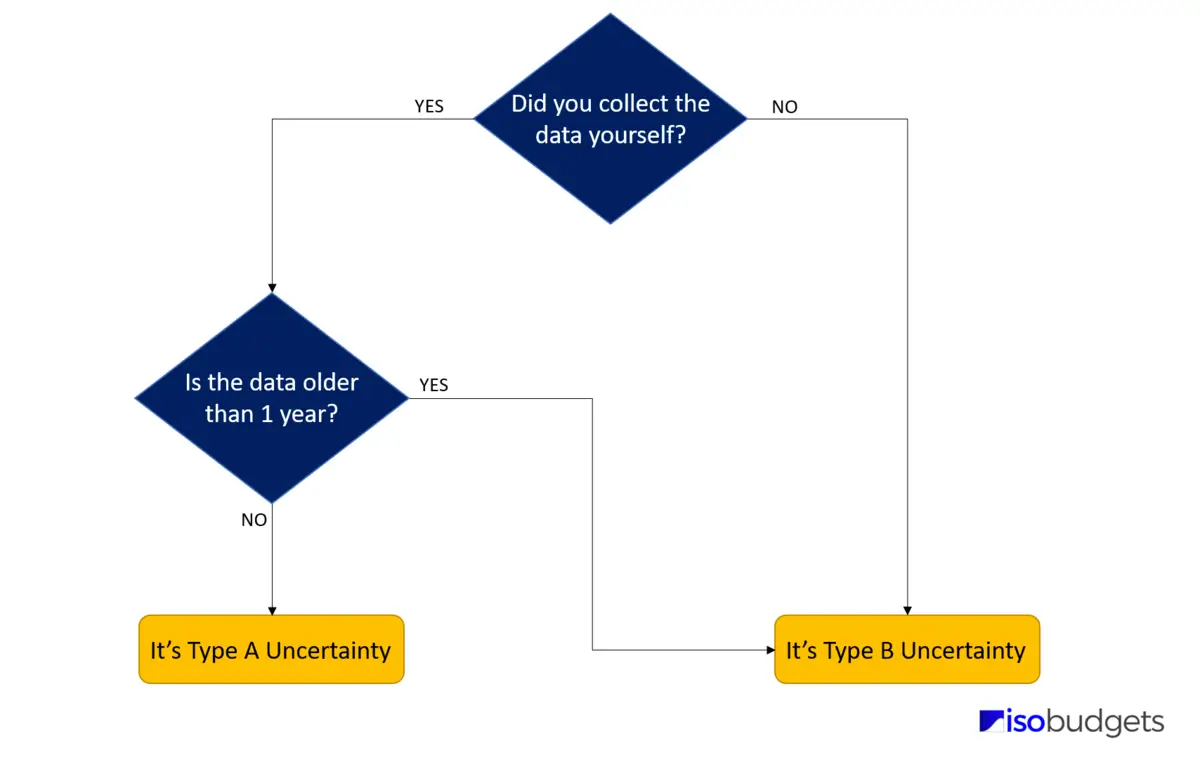
4.3 How to Pick an Uncertainty Type
If you are not sure which uncertainty type you should pick, ask yourself the following questions:
1. Did you collect the data yourself via testing and experimentation?
- If YES, go to question 2
- If NO, choose Type B
2. Is the data older than 1 year?
- If YES, choose Type B
- If NO, choose Type A
4.4 Probability Distributions
This is an important step because the probability distribution that you select will determine how your source of uncertainty is converted to a standard deviation in the next step.
Although there are many different types of probability distributions, the most commonly used distributions when estimating uncertainty are:
- Normal (i.e. Gaussian) distribution,
- Rectangular (i.e. Uniform) distribution, and
- Triangle Distribution
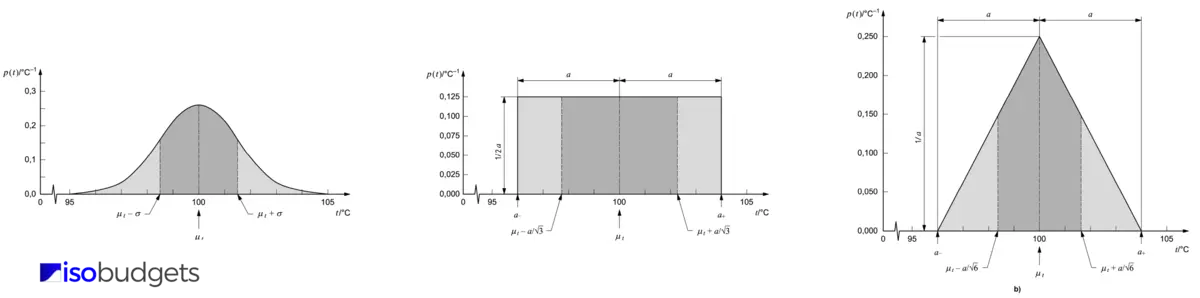
If you read the GUM (i.e. JCGM 100:2008), you will notice this in sections 4.2 through 4.4. Most of the recommendations and illustrations focus on these three distributions.
In the image below, you will see illustrations of the normal, rectangular, and triangle distributions from section 4.4 of the JCGM 100:2008.
4.4.1 Probability Distributions for Estimating Uncertainty
Below is a list of popular probability distributions used to estimate uncertainty. Each distribution has a specific use case for its application. You will find these distributions in many uncertainty guides, standard methods, and uncertainty calculators.
- Normal (i.e. Gaussian) Distribution
- Rectangular (i.e. Uniform) Distribution
- Triangular Distribution
- Log-Normal Distribution
- U-shaped Distribution
- Rayleigh Distribution
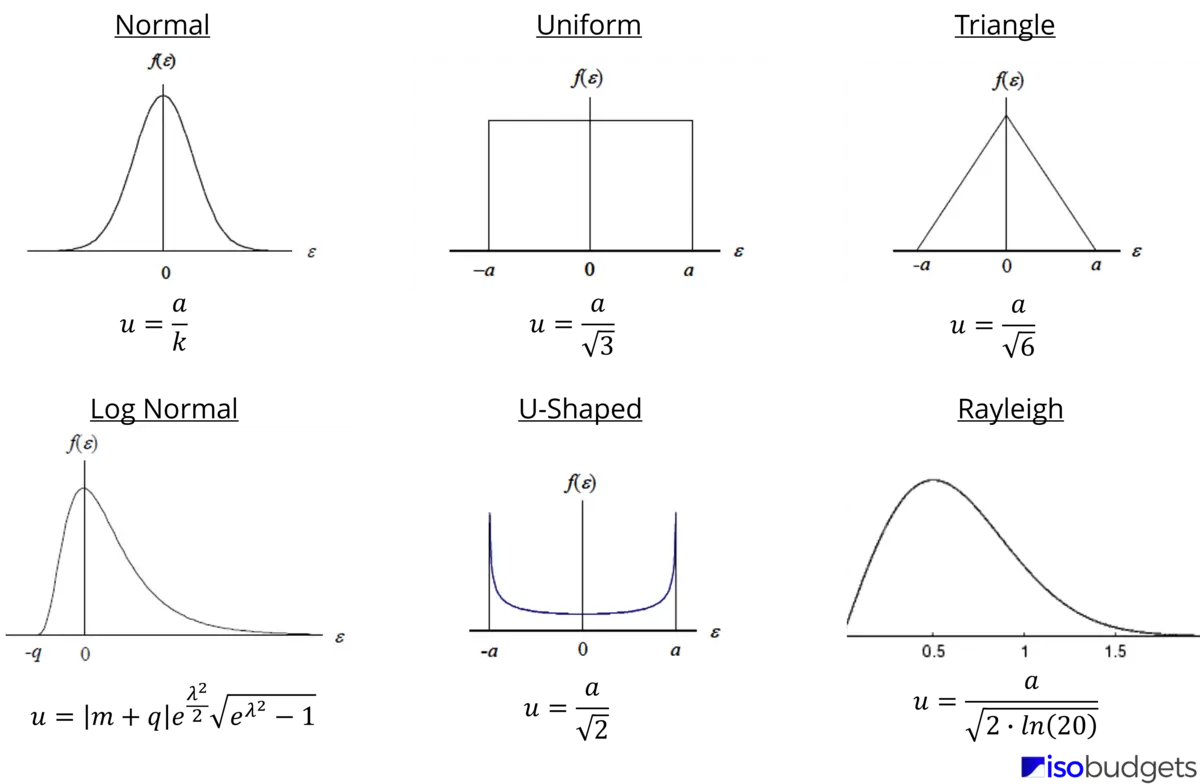
In the image below, you will see a comparison chart of these probability distributions. I created this image, so you can see:
- an illustration of each distribution, and
- their associated divisors (for converting to standard uncertainties)
Use this chart to help you select the right probability distribution for your application.
4.5 Selecting a Probability Distribution
To assign the appropriate distribution, consider how to characterize the data set for each source of uncertainty. In the list below, you will find common uncertainties and their associated distributions:
- If you evaluated Type A uncertainty data, you typically assign a Normal distribution.
- If you evaluated reference standard uncertainty from a calibration report or certificate of analysis, you typically assign a Normal distribution.
- If you evaluate accuracy specifications, tolerance limits, or maximum permissible error, investigate to determine whether to assign a:
- Normal distribution,
- Rectangular distribution, or
- Triangle distribution.
- If you evaluated resolution, environmental, or other uncertainties, you will typically assign a rectangular distribution.
- If you are not sure what distribution to use, then it is typically less risk to assign a rectangular distribution.
If you still need help picking a probability distribution, then I recommend reading the JCGM 100:2008, sections 4.2 and 4.3. It includes criteria and recommendations to help guide you to the right decision. Otherwise, the safest option is selecting a rectangular distribution.
In the sections below, you will find some methods and tools to help you pick a probability distribution. I made the tables and flowcharts based on recommendations in the GUM (JCGM 100:2008).
4.6 How to Assign a Probability Distribution
When selecting a probability distribution, you have two options:
- Method A: Create and Evaluate a Histogram
- Method B: Select a Probability Distribution Based on Recommendations
Typically, you will use Option B. It is the most commonly used method.
In the sections below, I will give you more information about each of these methods. Plus, I will give you some helpful tips and tools I use to pick probability distributions.
4.6.1 Method A: Create and Evaluate a Histogram
Creating a histogram is best for evaluating experimental and Type A uncertainty data. It will help you visualize the distribution of data. This is why they are useful for determining the probability distribution.
Plus, you can easily create a histogram using statistical software, Microsoft Excel, or Google Sheets.
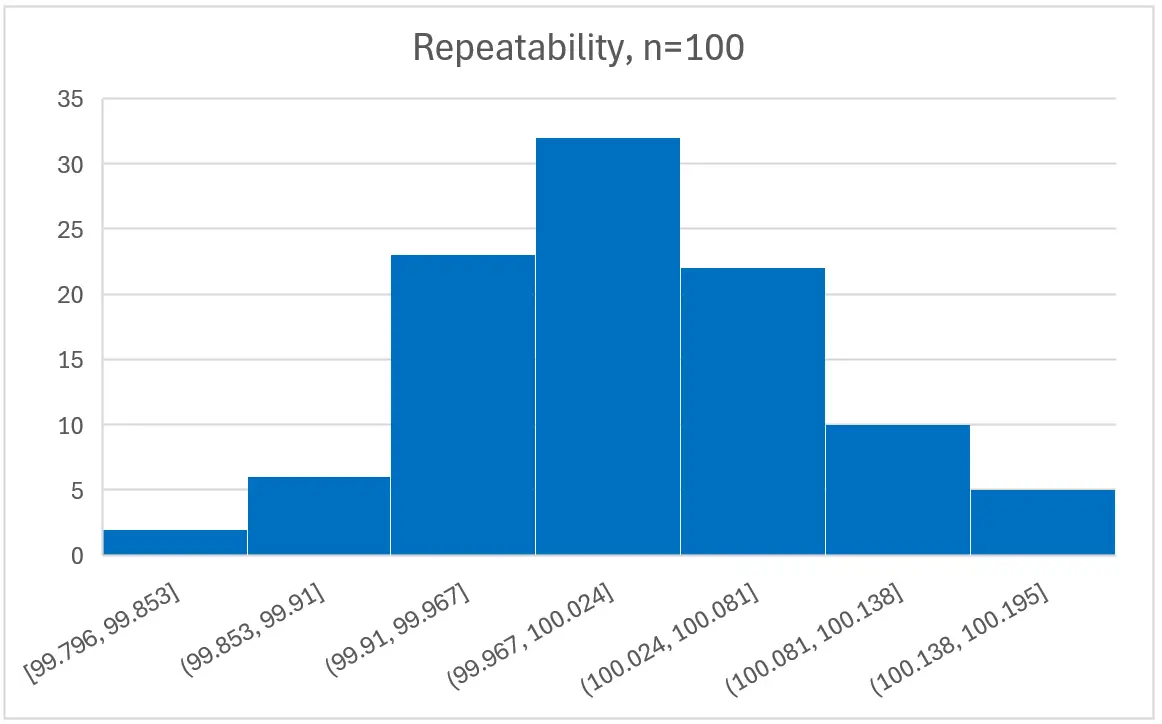
In the image below, you will see a histogram of the results from a repeatability test. The repeatability test included 100 samples which is why you can easily see the data resembles a normal distribution.
Since most repeatability and reproducibility tests include fewer results, such as n=20, it can be more difficult to visualize the distribution. This can make using histograms less effective.
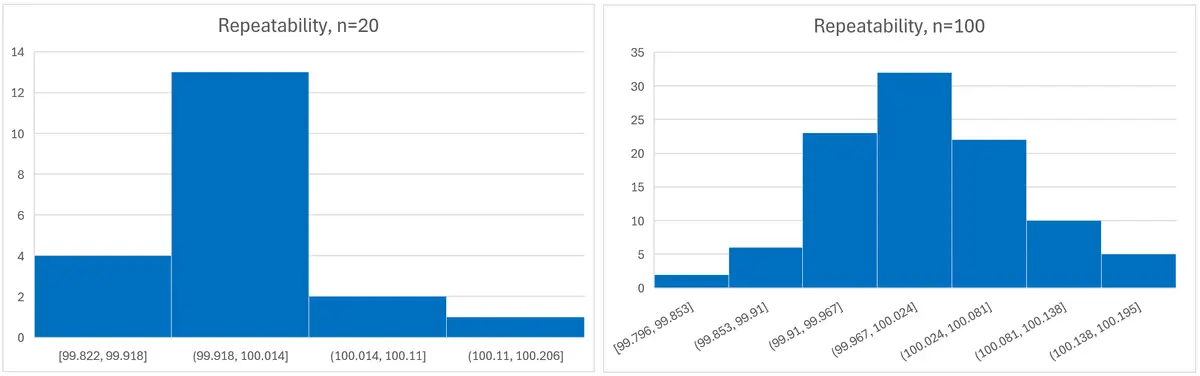
In the image below, you can see the difference in the histogram due to sample size. The image on the left is from the same data set but includes only the first 20 results. The image on the right includes the full data set of 100 samples.
You can clearly see the difference. The histogram on the right looks more like a Normal distribution. This is consistent with the Central Limit Theorem.
Also, some distributions are more difficult to visualize making them subjective to interpretation.
In summary, histograms are an effective tool for assigning probability distributions but may not be ideal for every scenario. Therefore, you may find method B more useful for most scenarios.
4.6.2 Method B: Probability Distribution Decision Tools
Creating histograms is not for everyone. You can only make one if you have data (and software). In most cases, you will not be able to create a histogram because your uncertainties will be quantified by data acquired from the following:
- Calibration reports,
- Certificates of analysis,
- Manufacturer manuals and datasheets,
- Published papers and guides, and(or)
- Standard methods (ISO, ASTM, etc.)
Information and data from these sources may other little to no information about how the uncertainty was evaluated. As a result, you will need to make assumptions to select the right probability distribution.
To help you out, I have created tools to make this process easier. These tools include:
- A Summary Table of Commonly Used Probability Distributions,
- Probability Distribution Decision Tree, and
- Probability Distribution Decision Chart.
In the sections below, I will show you these tools and explain how to use them.
4.6.2.1 Tool 1: Probability Distribution Decision Tree
In the image below, you will find a decision tree to help you find the right probability distribution. I created this tool based on the recommendations in the JCGM 100:2008, sections 4.2 and 4.3.
The decision tree guides you through a series of “Yes” or “No” questions that will help you choose the right probability distribution.
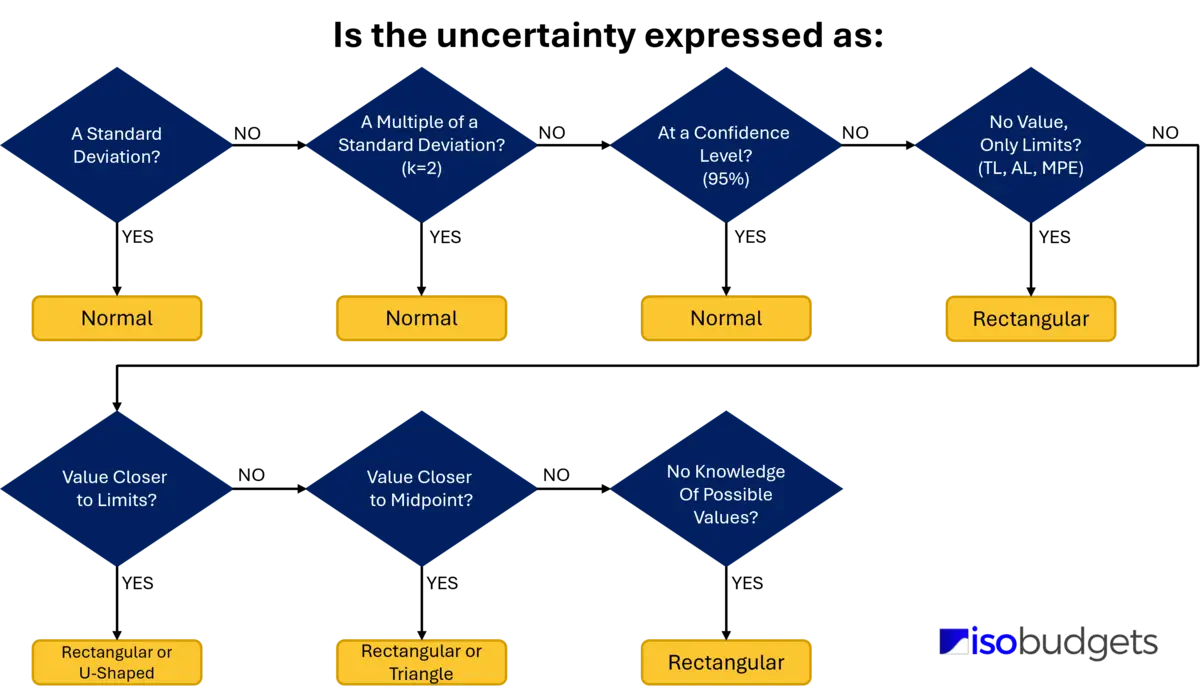
How to Use the Decision Tree
Starting at the top-left of the image, answer the following questions until you respond “Yes” to the scenario. The questions and decisions are based on the JCGM 100 (GUM), sections 4.2 through 4.3.
1. Is the uncertainty a standard deviation?
- If “Yes,” then Normal distribution
- If “No,” then go to the next question
2. Is the uncertainty a multiple of a standard deviation?
- If “Yes,” then Normal distribution
- If “No,” then go to the next question
3. Is the uncertainty expressed to confidence interval?
- If “Yes,” then Normal distribution
- If “No,” then go to the next question
4. Is the uncertainty a combination of several factors?
- If “Yes,” then Normal distribution
- If “No,” then go to the next question
5. Is the uncertainty only based on limits with no measurement value?
- If “Yes,” then Rectangular distribution
- If “No,” then go to the next question
6. Is the uncertainty based on limits, but the measurement value is closer to the limits?
- If “Yes,” then Rectangular or U-Shaped distribution
- If “No,” then go to the next question
7. Is the uncertainty based on limits, but the measurement value is closer to the midpoint than the limits?
- If “Yes,” then Rectangular or Triangle distribution
8. Is the uncertainty quantified with no knowledge of possible values?
- If “Yes,” then Rectangular distribution
This decision tree covers the majority of scenarios most people will encounter when evaluating measurement uncertainty. However, it does not cover all of them. For example, if you estimating uncertainty for RF Power measurements, then you will need to characterize mismatch uncertainty using a Ring, Rayleigh, or U-Shaped distribution.
See Keysight’s Fundamentals of RF Guide number 3.
Otherwise, make sure to refer to any recommendations given in standard methods, reference documents, and measurement-specific guides.
4.2.6.2 Tool 2: Probability Distribution Decision Table
In the image below, you will find a table I designed to help you find the right probability distribution based on the following conditions:
- Uncertainty Type: A or B, and
- Uncertainty Estimate: Information about the uncertainty contributor.
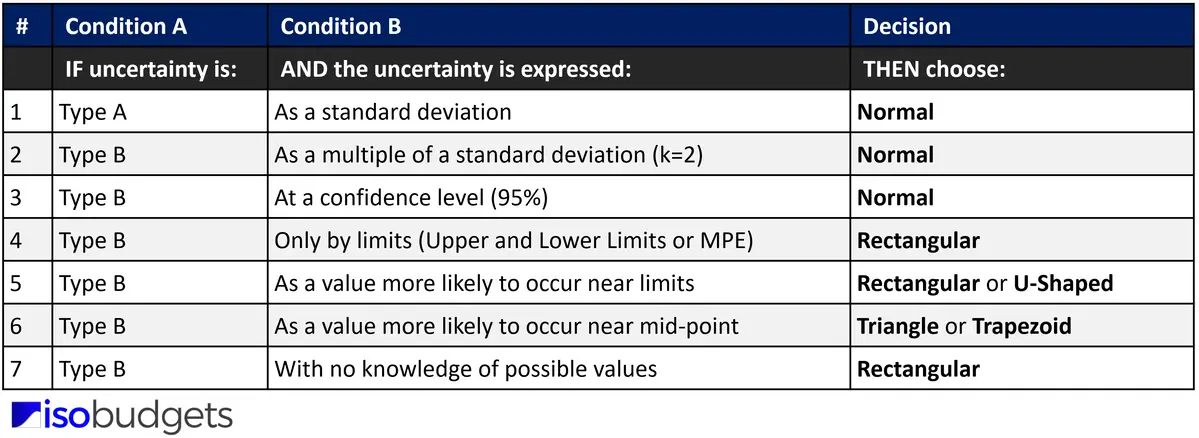
How to Use
To use the table, follow the instructions provided below. The table works by matching condition A (i.e. Uncertainty Type) and condition B (i.e. Uncertainty Estimate Type) to find which probability distribution to select.
- Determine if the uncertainty is Type A or Type B.
- Assess information about the uncertainty expressed in your budget.
- Match the conditions in the “Condition A” and “Condition B” columns.
- Find the recommended probability distribution in the last column.
4.6.2.3 Tool 3: Probability Distribution Table for Common Contributors
Finally, the table below gives recommended probability distributions for the 7 most common sources of uncertainty typically required in uncertainty budgets. I made this table and use it as a cheat sheet in my measurement uncertainty training course.
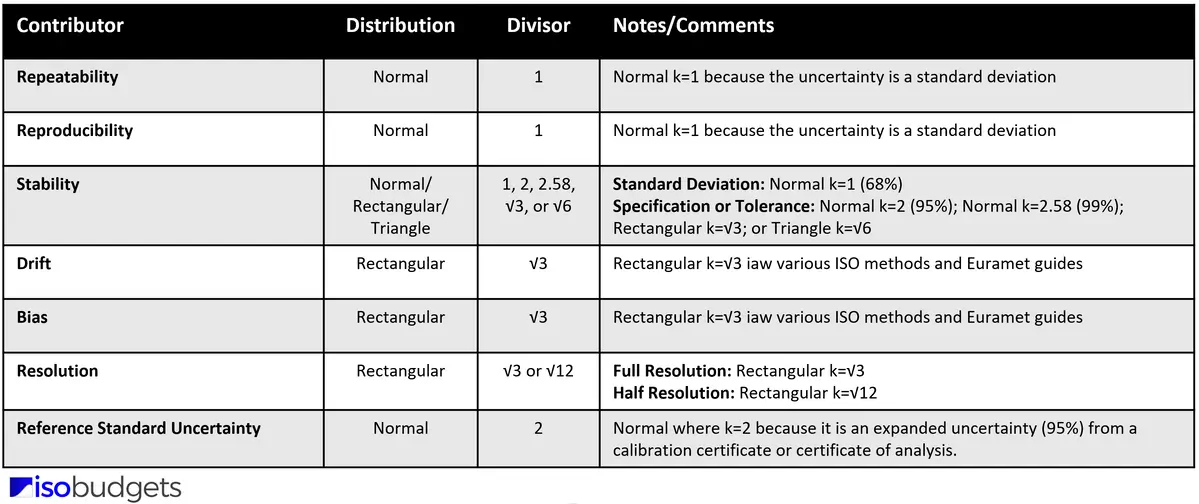
How to Use
To use the table, find the uncertainty contributor (you are evaluating) in the left-most column. Then, look at the distribution and notes column to find the right probability distribution for your situation. Step-by-step instructions are provided below.
- Find the uncertainty contributor in the first column,
- Review the recommended probability distributions and notes to find the right distribution for your uncertainty analysis.
4.7 Guidance on Probability Distributions for Uncertainty
If you want to learn more about probability distributions, check out the following guides:
- ISOBudgets – Probability Distributions for Estimating Uncertainty
- JGCM 100:2008 – Guide to the Expression of Uncertainty in Measurement; Sections 4.2 and 4.3
Step 5: Convert Uncertainty Components to Standard Deviation Equivalents
Once you select a probability distribution, you can find the divisor needed to convert each uncertainty contributor to a standard deviation equivalent. This will change each source of uncertainty to a 1-sigma level (i.e. 68.27% confidence), so you can properly combine them using the GUM method in the next step.
Make sure to perform this task for each uncertainty contributor.
5.1 How to Convert Uncertainty to Standard Deviations
To convert uncertainty components to standard deviations, follow the instructions listed below:
- Assign a probability distribution to each source of uncertainty,
- Find the divisor for the selected probability distribution,
- Divide each source of uncertainty by it’s associated divisor.
Use the chart below to find the divisor associated with the probability distribution that you selected in step 4.
Next, divide your uncertainty components by the appropriate divisor to convert them to a standard uncertainty. Afterward, all of your contributors should be on the same confidence level (i.e. 1-sigma or 68.27%) and equivalent to a standard deviation.
5.2 What Divisor to Use to Convert Uncertainty
To convert uncertainty to standard deviations, it is best to understand more about probabilities distributions and their associated divisors.
5.2.1 Normal Distribution
If you select a Normal distribution, then you will divide your uncertainty by it’s associated coverage factor, k.
Use the Table from the JCGM 100:2008, Appendix G.
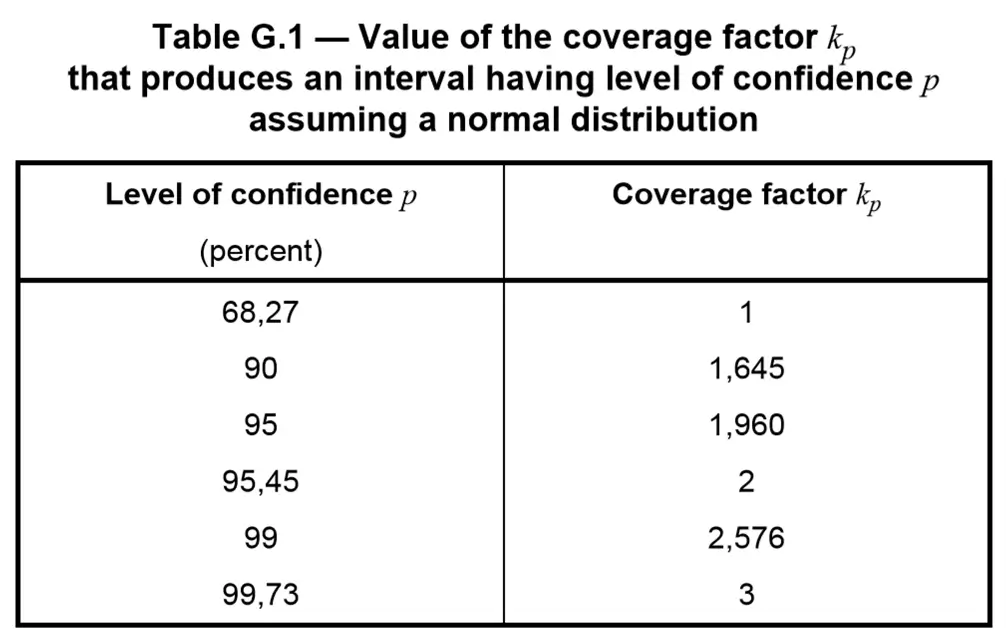
Take a closer look at the sources of uncertainty that you are evaluating to determine what coverage factor you should use. Typically, your contributors will have a confidence level of 68%, 95%, or 99%. Respectively, this means that you will use a divisor of 1, 2, or 2.576.
5.2.3 Rectangular Distribution
If you select a Rectangular distribution, then you will divide your uncertainty component by the square root of 3 or 1.7321.
If the Rectangular distribution is evaluated as a half-interval, such as resolution, then divide your uncertainty component by the square root of 12 or 3.4641.
5.2.4 U-Shaped Distribution
If you select a U-shaped distribution, then you will divide your uncertainty component by the square root of 2 or 1.4142.
5.2.5 Triangular Distribution
If you select a Triangular distribution, then you will divide your uncertainty component by the square root of 6 or 2.4495.
5.2.6 Quadratic Distribution
If you select a Quadratic distribution, then you will divide your uncertainty component by the square root of 5 or 2.2361.
5.2.7 Log-Normal Distribution
If you select a Log-Normal distribution, then you will divide your uncertainty component by 2.3750.
5.2.8 Rayleigh Distribution
If you select a Rayleigh distribution, then you will divide your uncertainty component by 2.4477.
5.3 Handling Components With Different Units of Measurement
The most important thing to remember when converting uncertainty to standard deviation equivalents is to make sure all the standard deviations are in the same units of measurement. This is critical before calculating the combined uncertainty. Otherwise, your estimated uncertainty will be incorrect.
You cannot combine uncertainties with different units of measurement (without the use of sensitivity coefficients).
If you have contributors with different units of measurement, you will need to use sensitivity coefficients to convert them to units of measurement that match the measurement result or a term relative to the measurement result (e.g. percent).
Many people make this mistake when estimating uncertainty of measurement. So, make sure to check this before you calculate the combined standard uncertainty.
5.4 Sensitivity Coefficients
If you want to learn more about sensitivity coefficients, just click the link below to check out my guide on sensitivity coefficients.
Step 6: Calculate the Combined Uncertainty
After converting your uncertainty sources to standard deviation equivalents, it is time to calculate the combined uncertainty using the root sum of squares (i.e. RSS) method recommended in the Guide to the Expression of Uncertainty in Measurement (i.e. GUM; JCGM 100:2008).
This will mathematically combine your uncertainty sources in quadrature. So, keep reading to learn how to combine uncertainty.
6.1 How to Calculate the Combined Uncertainty
To calculate the combined standard uncertainty, follow the instructions below:
- Square the value of each uncertainty component,
- Add together all the squared uncertainties (i.e. Sum of Squares),
- Calculate the square root of the Sum of Squares (i.e. Step 2).
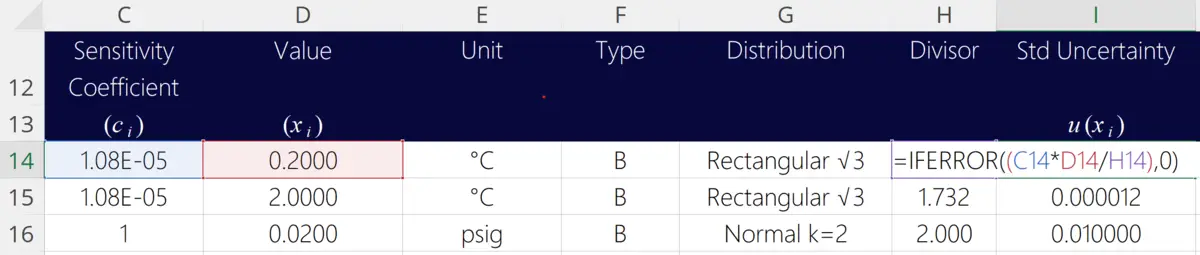
Look at the image below to see the Microsoft Excel formula I use to calculate the combined standard uncertainty.
To summarize the instructions above, simply square the value of each uncertainty contributor. Next, add them all together to calculate the sum (i.e. the sum of squares). Then, calculate the square-root of the summed value (i.e. the root sum of squares). The result will be your combined standard uncertainty.
After you complete this process, you will have the combined standard uncertainty at a 1-sigma level (i.e. 68.27% confidence) characterized by a Normal distribution per the Central Limit Theorem.
6.2 Central Limit Theorem
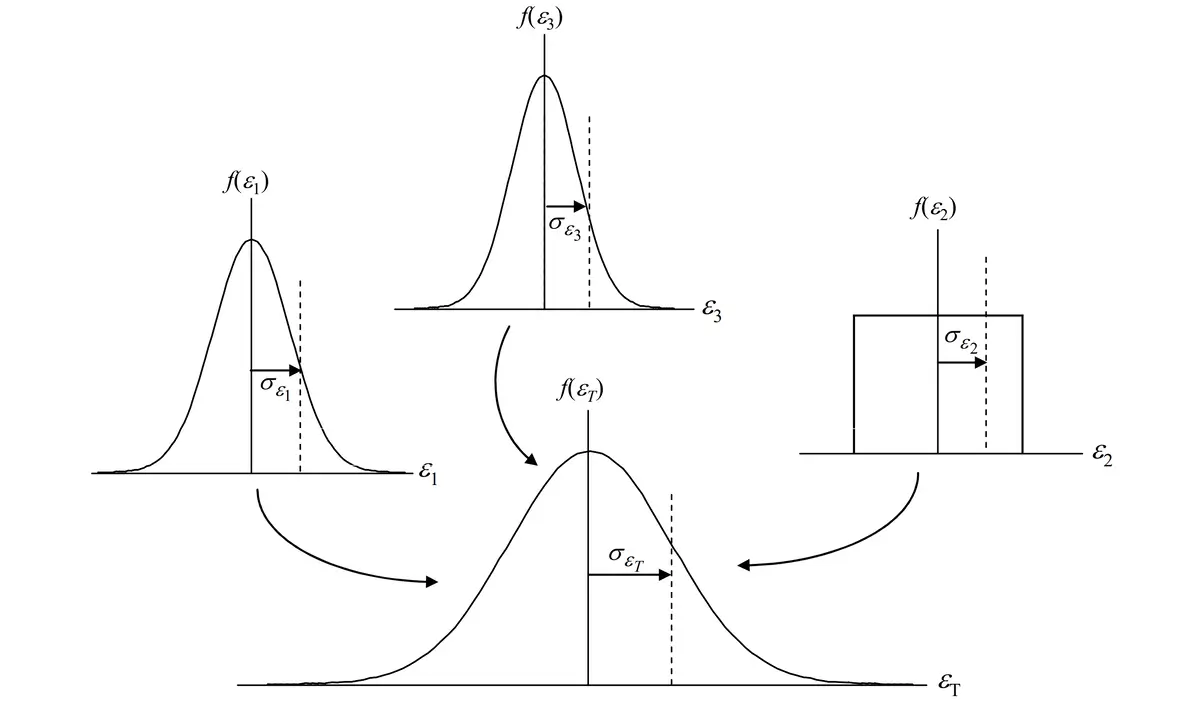
When you combine uncertainty sources, you are also combining their probability distributions.
According to the Central Limit Theorem, the sum of the set of independent random variables (i.e. uncertainty sources) will approach a normal distribution regardless of the individual variable’s distribution.
Therefore, the probability distribution associated with your combined uncertainty will now be normal. Look at the above image for a visual representation.
6.3 Root Sum of Squares Method
If you are a more visual learner, like me, take a look at the process below to see if it makes more sense.
Below, you will see the equation for calculating the combined uncertainty.
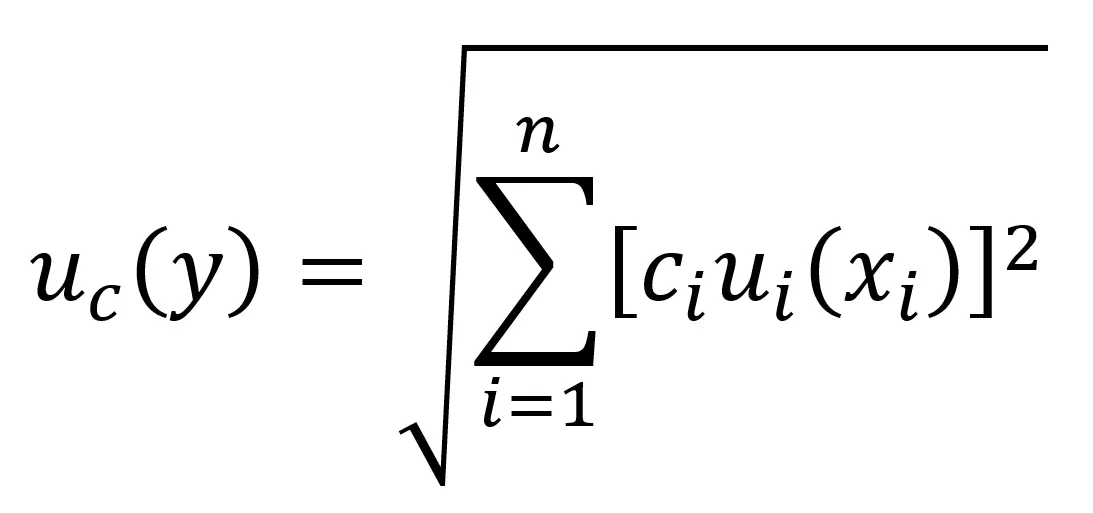
ci = sensitivity coefficient
ui(xi) = uncertainty of x
uc(y) = uncertainty of y
If the equation above looks confusing, you can try the simplified version below.
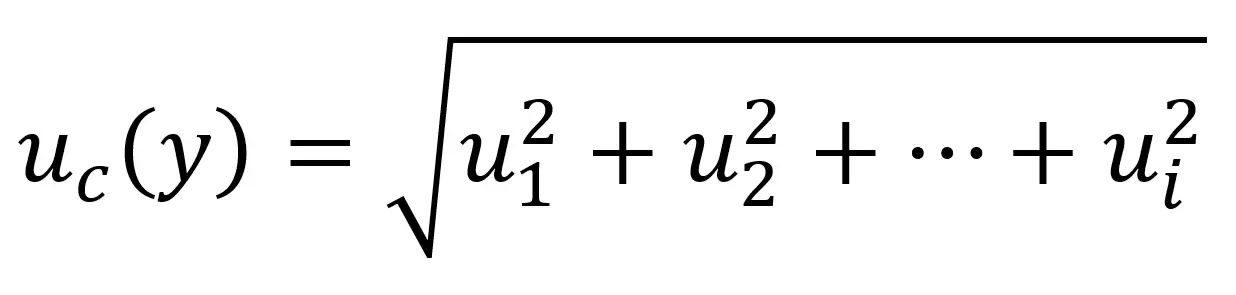
ui = uncertainty of x
uc(y) = uncertainty of y
This is the equation that I typically use since I usually include sensitivity coefficients (i.e. ci) earlier in the process before I convert uncertainty components to standard deviations.
If you evaluate measurement uncertainty the same way, you should be able to use the simplified equation. If you do not use sensitivity coefficients, you can use the simplified equation as well.
Both equations give you the same result. So, use the equation that works best for you. If you are using an excel spreadsheet calculator, you may find the function in the next section beneficial.
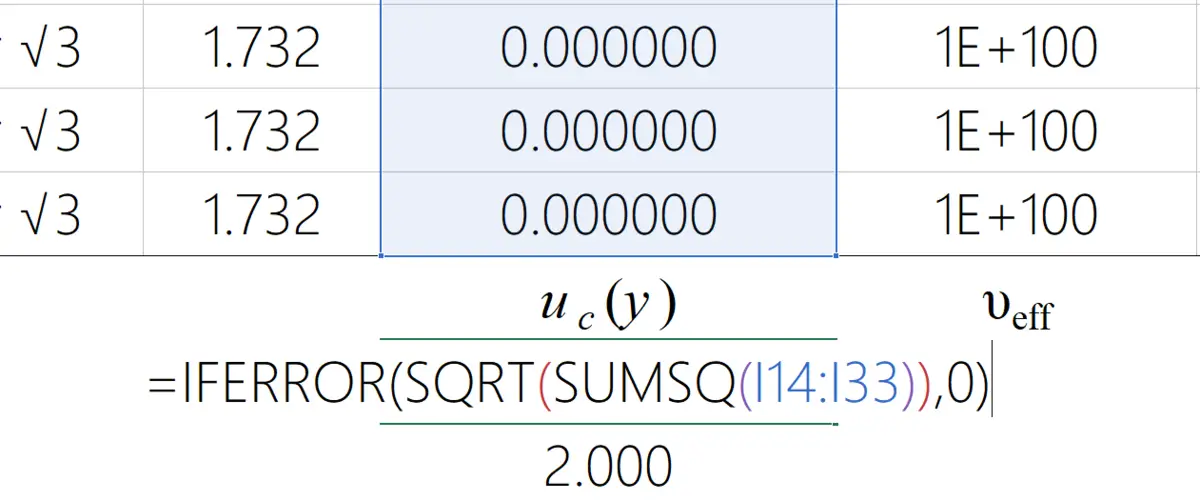
6.4 Excel Function for Combining Uncertainty
If you use Microsoft Excel to estimate uncertainty, you can easily combine uncertainty using the formula below. It is a combination of the square root and sum of squares function.
Take a look at the image below to see the function used in my Simple Uncertainty Calculator.
If you want to learn more about calculating the combined uncertainty, click the link to read the guide: How to Calculate Combined Uncertainty.
Step 7. Calculate the Expanded Uncertainty
You are almost done estimating uncertainty, so stay with me. I am going to show you how to calculate expanded uncertainty.
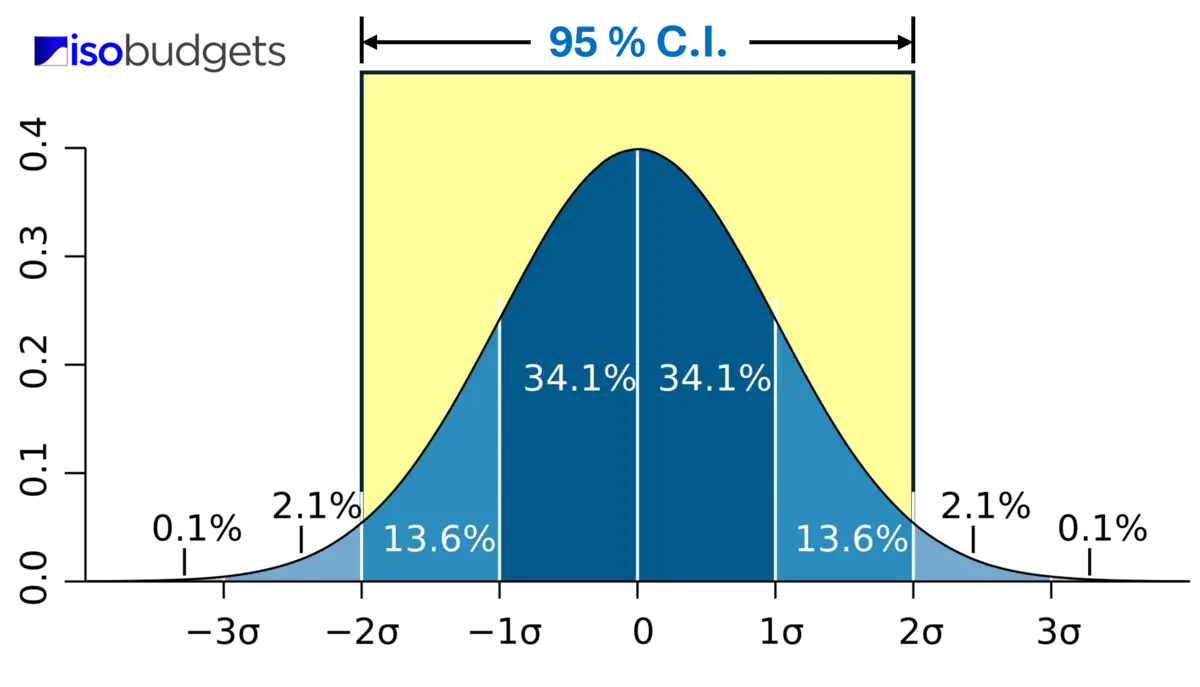
In this step, you are going to learn how to calculate the expanded uncertainty to a 95% confidence interval. To do this, you will need to select a coverage factor and multiply it by the calculated combined uncertainty.
Look at the image below to see the normal probability distribution when you expand your uncertainty to 2-sigma or 95.45% confidence.
7.1 How to Calculate the Expanded Uncertainty
To calculate the expanded measurement uncertainty, follow the instruction below:
- Calculate the Combined Uncertainty,
- Calculate the Effective Degrees of Freedom (optional),
- Determine the Coverage Factor (k), and
- Multiply the combined uncertainty by the coverage factor.
The result will be the expanded uncertainty. If you use a coverage factor of 2 or 1.96, then you will expand uncertainty to a 95% confidence level.
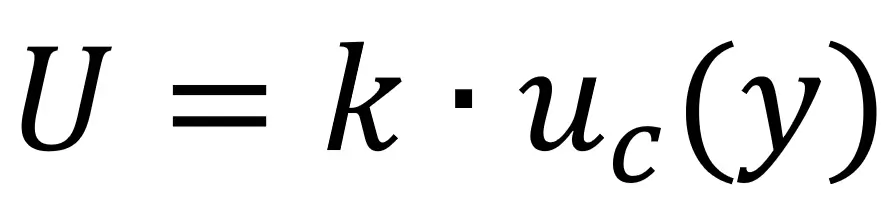
Check out the simplified equation below for calculating the expanded uncertainty.
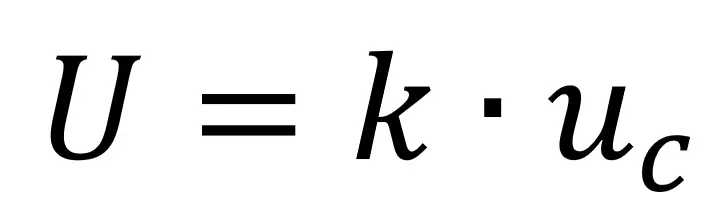
U – Expanded Uncertainty
k – Coverage Factor
uc – Combined Uncertainty
In the next section, you will learn some options for selecting a coverage factor.
7.2 Selecting a Coverage Factor
The coverage factor is the multiplier you will use to expand uncertainty. ISO/IEC 17025 accredited labs must express uncertainty to a 95% confidence interval. However, you have some options. You can use:
- k=2 for a 95.45% confidence interval,
- k=1.96 for a 95% confidence interval, or
- the Student’s T table to find your coverage factor (k).
The most recommended coverage factor is k=2. However, if your effective degrees of freedom is less than 10, it is recommended to use the Student’s T table to find the coverage factor.
Click the link below to see the Student’s T table.
Coverage Factors and Expanded Uncertainty
In the image below, you will see Table G.1 from the JCGM 100:2008 (GUM). The table provide the coverage factors needed to achieve a specific level of confidence. You will see that I highlighted the 95 % confidence intervals and associated coverage factors with a red rectangle.
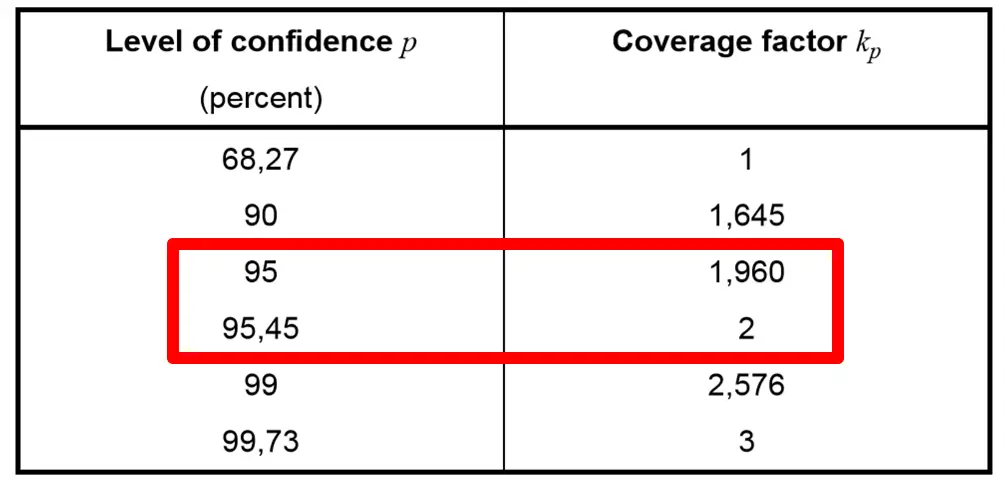
To meet ISO/IEC 17025:2017 requirements, you must expand uncertainty to approximately 95%. Most people use an expansion factor (k) of 2 to achieve a confidence interval of 95.45%. However, you can also use an expansion factor of 1.96 for a confidence interval of exactly 95.00%.
Additionally, you can find your coverage factor using the Student’s T table. This is not common, but it is an option if you need it. Just calculate the effective degrees of freedom using the Welch Satterthwaite equation and use the Student’s T table to find the right coverage factor to achieve a 95% confidence interval.
The choice is yours. Just make sure to select an expansion factor that you will consistently use in each of your uncertainty analyses. Furthermore, it helps to know why you chose your expansion factor so you can justify it to assessors (if they ask).
- Use a standard k-factor (e.g. 2 or 1.96) when your uncertainty budget contains plenty of sources of uncertainty (Type A and Type B) each with their own value,
- Use the Student’s T table when your uncertainty analysis is limited to mostly Type A data (ISO 21748 and ISO 19036) or your effective degrees of freedom is less than 10. See JCGM 100:2008, section G6.6.
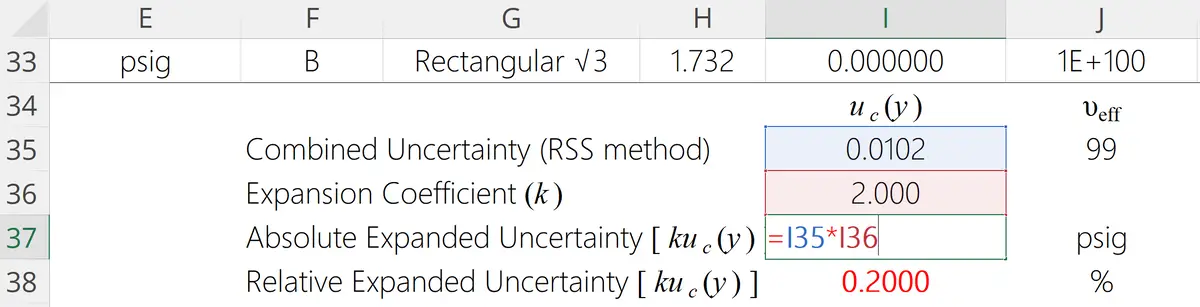
7.3 Calculating the Expanded Uncertainty
After finding your coverage factor (k), calculate the expanded uncertainty by multiplying the coverage factor and the combined standard uncertainty. Use the formula below for guidance.
U – Expanded Uncertainty
k – Coverage Factor
uc(y) – Combined Uncertainty
The result is the expanded uncertainty (i.e. U). This is your uncertainty in measurement estimated to a 95% confidence interval.
Look at the image below to see the equation used in one of my uncertainty calculators.
That’s it! You have just learned how to calculate expanded uncertainty in 7 steps and completed the process for the estimation of uncertainty in measurement.
However, you are not done yet. I recommend that you verify your calculations and evaluate your results. In the next section, I will tell you how to evaluate uncertainty calculations for appropriateness.
7.4 More Guidance on Expanded Uncertainty
To learn more about coverage factors and expanded uncertainty or making CMC Uncertainty equations for your scope of accreditation, click the links below:
Bonus: Evaluate Uncertainty for Appropriateness
Once you have calculated the expanded uncertainty, it is best to evaluate your uncertainty estimate for appropriateness. Essentially, you want to make sure that your measurement uncertainty estimate adequately represents your measurement process and is not overestimated or underestimated.
8.1 How to Evaluate Your Uncertainty Budget
To evaluate your expanded measurement uncertainty estimates, use one or more of the following methods listed below. Then, determine if your expanded uncertainty is reasonable and appropriate.
8.1.1. Evaluate the Significance of Uncertainty Contributors
For this evaluation, calculate the significance of each source of uncertainty and analyze how much it influences your total measurement uncertainty. Double check uncertainty components with excessively large and small percentages to verify their value is correct.
For example, you do not want a significant source of uncertainty to have a small percentage of influence on the expanded uncertainty or vice-versa. If this happens, you should investigate to ensure your uncertainty estimates and calculations are correct.
When evaluating significance, make sure you do not see the following:
- Significant contributor with a small percentage of significance,
- Insignificant contributor with a large percentage of significance, or
- Any contributor with a percentage that is not consistent with previous or similar uncertainty analyses.
Learning to evaluate the significance of your uncertainty contributors can be helpful tool when reviewing or validating your uncertainty budgets. The more you know about your test and measurement systems, the easier it is notice patterns and problems in your uncertainty budgets.
In the image below, you will see the Significance Check column that I add to my uncertainty budgets and calculators. Additionally, notice that I add a heatmap effect to find the largest contributors to measurement uncertainty.
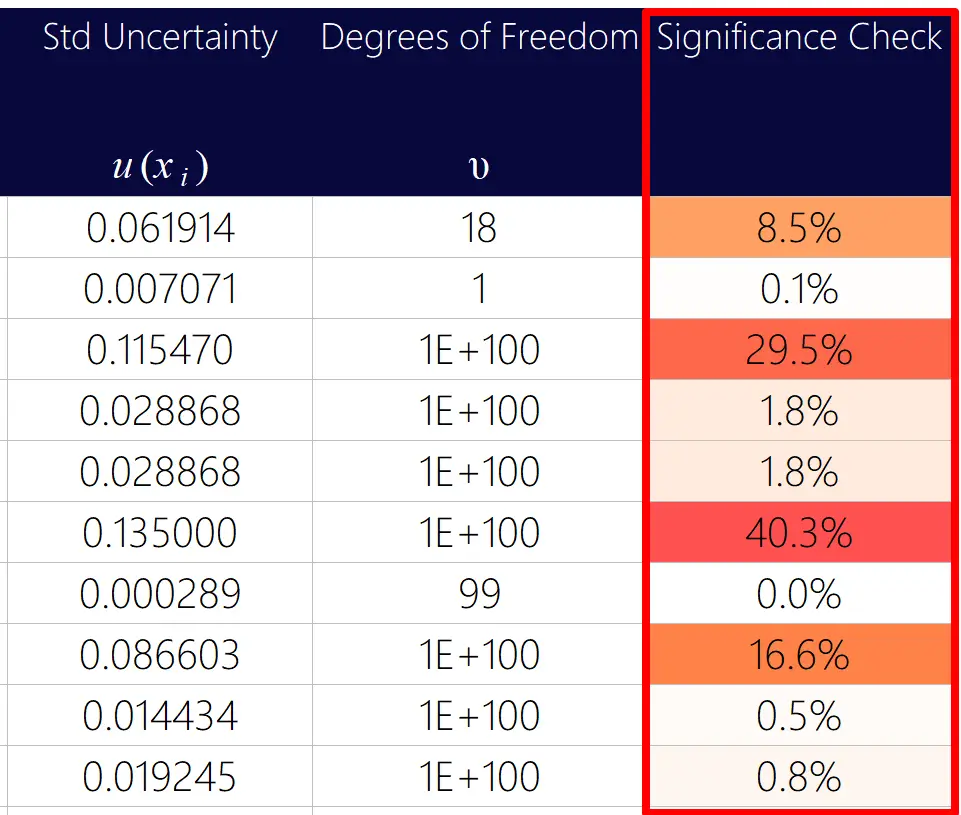
It is a helpful tool that I use all of the time to validate my uncertainty analyses or make recommendations to help a lab reduce their measurement uncertainty.
TIP: If you need to decrease your expanded measurement uncertainty, find the top 3 significant contributors and determine how to reduce their magnitude of uncertainty. This will make the biggest difference when trying to meet your goals, such as a better test uncertainty ratio (TUR) or process capability index (Cpk).
8.1.2. Expanded Uncertainty vs Reference Standard Uncertainty
For this evaluation, review the expanded uncertainty in your uncertainty budget and verify that it is larger than your Reference Standard Uncertainty. If not, you have a problem and need to double check the value entered in your uncertainty budget and formulas used to calculate uncertainty.
The reference standard uncertainty is the uncertainty associated with your metrological traceability. Therefore, your uncertainty estimates must be larger than the uncertainty of the reference standard used to obtain traceability.
In the image below, you will see the measurement traceability pyramid where the measurement uncertainty increases the further down the pyramid your laboratory equipment is.
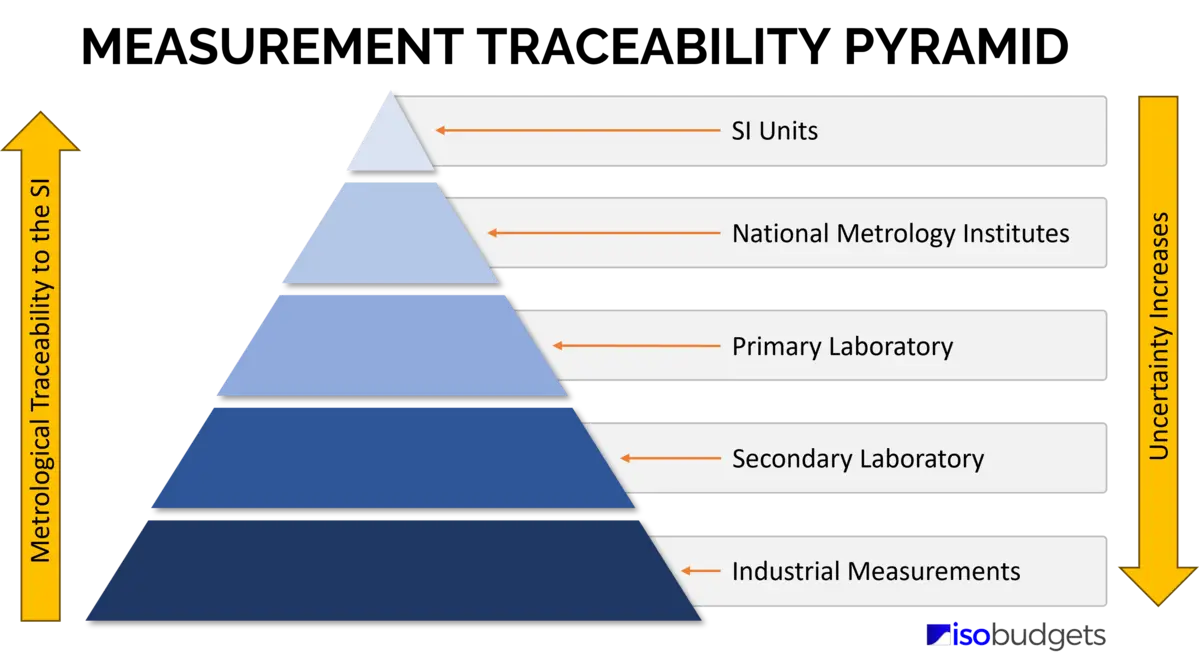
8.1.3. Expanded Uncertainty vs BIPM KCDB
For this evaluation, check the BIPM Key Comparison Database and make sure your expanded uncertainty is larger than the value reported by the national metrology institute (NMI) that you claim metrological traceability. Sometimes this is not available, but you should at least check.
According to the ILAC P14 Note 6, assessors are encouraged to check the BIPM Key Comparison Database when reviewing your uncertainty budgets. In the image below, you will see an excerpt from the ILAC P14 about this matter.
As a result, make sure to check the KCDB to evaluate your estimates of expanded uncertainty. Below, you will find a link to the Key Comparison Database and a screenshot of the KCDB webpage.
Click here to visit the BIPM Key Comparison Database
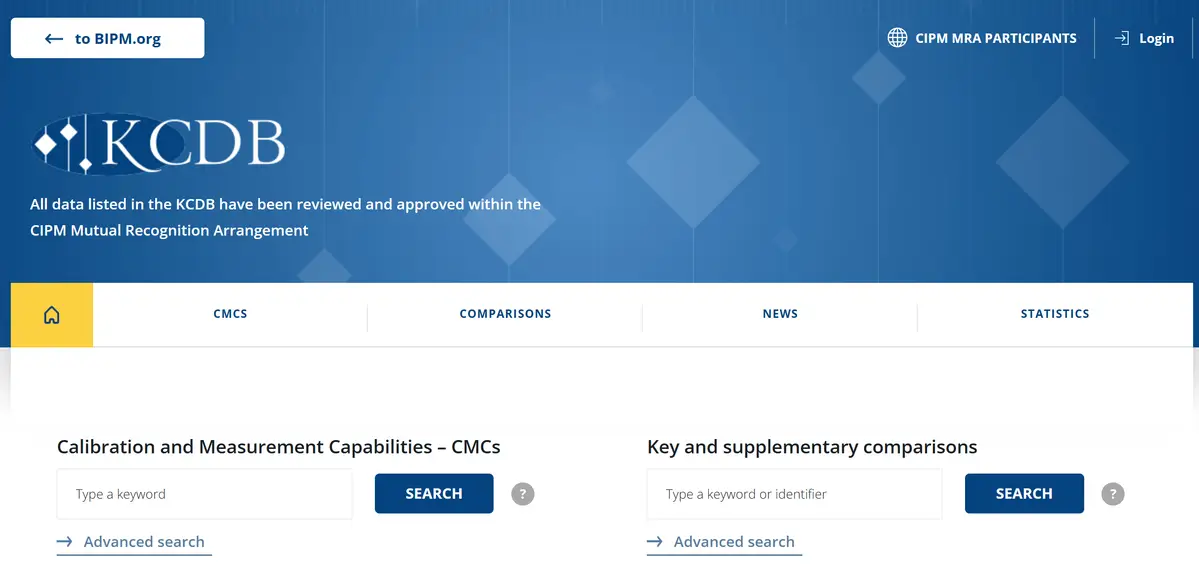
8.1.4. Expanded Uncertainty vs SRM Certificate of Analysis
For this evaluation, review the Certificate of Analysis for the standard reference material that your reference standard or material is traceable to and verify your uncertainty is larger than the uncertainty of the SRM.
For example, I recently reviewed the certificates of analysis for a pH solution made by an ISO 17034 accredited reference material producer. The RM certificate claimed an expanded uncertainty of ±0.006 pH.
However, the RM claimed traceability to NIST SRM 185h which reports an expanded uncertainty of ±0.010 pH. The reference material (RM) produced should not have less uncertainty than the standard reference material used to make it. This is why you need to review you SRM certificate when evaluating uncertainty.
Look at the image below for an excerpt from NIST SRM 185h certificate showing the uncertainty reported to a 95 % confidence interval.
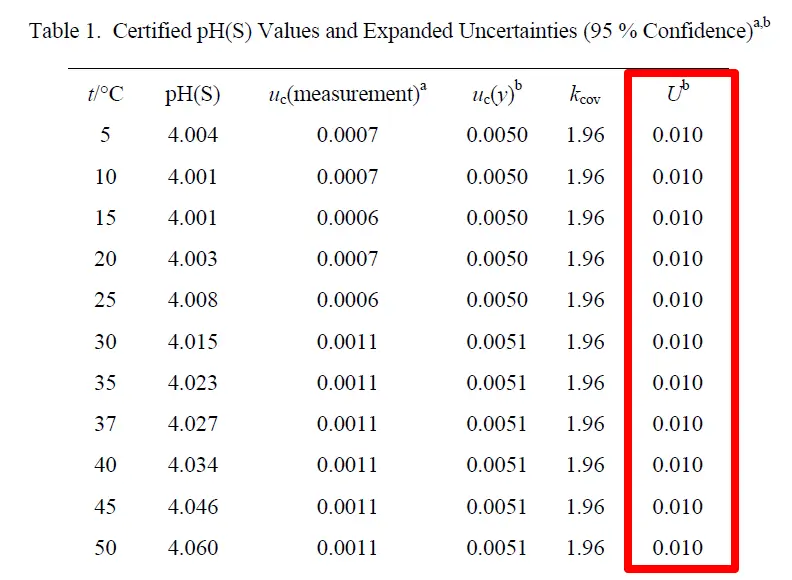
8.1.5. Expanded Uncertainty vs Other Lab Scopes of Accreditation
In this evaluation, compare your expanded uncertainty to the CMC uncertainties of other accredited laboratories. Search your accreditation body’s database and look at 3 to 5 other laboratory scopes of accreditation (with activities that are similar to yours) to make sure that your expanded uncertainty is reasonably comparable. If not, you may have overestimated or underestimated uncertainty.
If your laboratory activity is not advertised in other scopes from your accreditation body, then search scopes of accreditation from other accreditation body databases.
This option works best for calibration laboratories since their CMC uncertainties are published in their scopes of accreditation. This option is more difficult if you are a testing lab. Most testing labs do not report uncertainties in their scope of accreditation.
This can make it difficult to compare your capabilities with other laboratories. However, I have a solution in the next section that may help you evaluate your uncertainties.
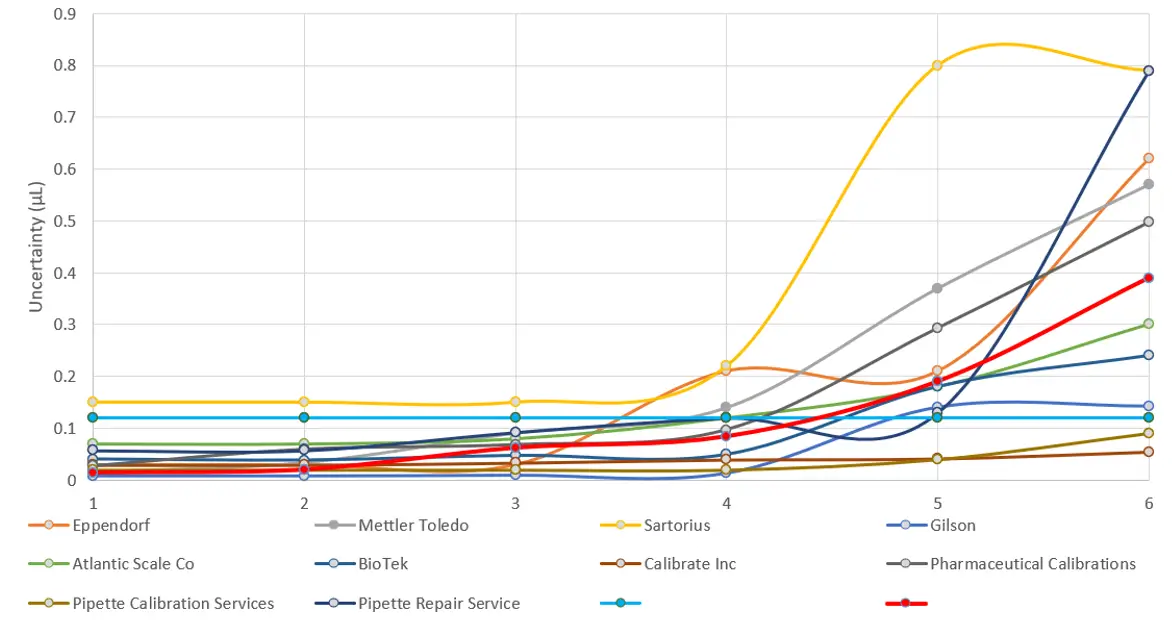
8.1.6. Expanded Uncertainty vs Other Labs PT/ILC Results
For this evaluation, participate in a proficiency testing scheme and compare your uncertainty with other laboratories. Then, determine whether or not your uncertainties are reasonable and appropriate. Make sure that your expanded uncertainty is not significantly larger or smaller than other participating laboratories.
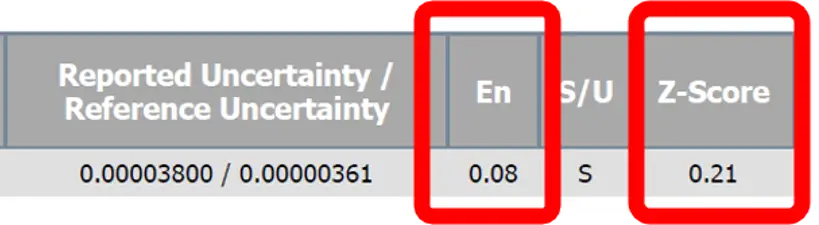
When evaluating your proficiency test results, look at your Normalized Error (En) and z-score values. Both can be beneficial for evaluating your uncertainty estimates.
- Normalized Error compares your laboratory’s performance to a reference laboratory.
- z-score compares your laboratory’s performance to other participating labs.
Here is a summary of how to evaluate your proficiency testing or interlaboratory comparison results.
- Normalized Error: If your En score is close to or larger than a value of one, then you may have underestimated measurement uncertainty or you may have a problem with your measurement process. As a result, re-evaluate your uncertainty budgets.
- Z-Score: If your z-score is close to or larger than a value of two (2), then you may have underestimated measurement uncertainty. As a result, re-evaluate your uncertainty budgets.
If your proficiency test report does not provide the uncertainties of participating labs, then consider organizing a small interlaboratory comparison. This will allow you to have access to the results so you can compare your expanded uncertainty with other laboratories.
Check out EA-04/21 for guidance on organizing a small interlaboratory comparison.
8.1.7. Expanded Uncertainty vs Type A Data
For this evaluation, perform a Repeatability and Reproducibility study in your laboratory. Verify that your results are not larger than your uncertainty estimation.
If Type A uncertainties are larger than the values in your uncertainty budget, you may have understated your expanded uncertainty. Investigate whether or not mistakes were made when performing the tests or measurements. If not, update your uncertainty budgets with the new results.
To learn more about performing repeatability and reproducibility testing, click the links below.
8.2 Final Thoughts on Evaluating Uncertainty
Evaluating your uncertainty budgets are critical. Although it is not a fool-proof process, it is better than doing nothing. You do not want to go through all the work of calculating measurement uncertainty only find mistakes during an assessment. It is better to perform the hard work upfront than deal with all the paperwork and headaches that result from being cited a deficiency. Furthermore, evaluating your uncertainty analyses gives you objective evidence to support your results should an assessor question your expanded uncertainty.
I hope that the evaluations given in the section help you validate your results.
Conclusion
Estimating measurement uncertainty is not easy. It requires a lot of time and effort. However, with the right processes, information sources, and tools, uncertainty analysis does not have to be difficult.
In this guide, I have laid out seven steps to help you calculate measurement uncertainty. While this is not a complete how-to guide, I have given you plenty of information to help you perform uncertainty estimation yourself. So, start estimating uncertainty and tell me what works for you and what you struggle with.
If you have additional questions or suggestions that will help improve this guide, contact me and share your comments. I will glad to get your feedback.
If you need more help, please check out some of my uncertainty calculator and measurement uncertainty training classes.
References
[2] Joint Committee for Guides in Metrology (JCGM). (2008). JCGM 100:2008 – Evaluation of measurement data – Guide to the expression of uncertainty in measurement (1st ed). Sèvres: BIPM.
[3] United Kingdom Accreditation Service. (2024). M3003: The Expression of Uncertainty and Confidence in Measurement (6th ed). Middlesex: UKAS.
[4] International Organization for Standardization. (2019). ISO 5725-2 – Accuracy (trueness and precision) of measurement methods and results – Part 2: Basic method for the determination of repeatability and reproducibility of a standard measurement method (2nd ed.). Geneva: ISO.
[5] International Organization for Standardization. (2023). ISO 5725-3: Accuracy (trueness and precision) of measurement methods and results — Part 3: Intermediate precision and alternative designs for collaborative studies (2nd ed.). Geneva: ISO.
[6] International Organization for Standardization. (2017). ISO 21748: Guidance for the use of repeatability, reproducibility and trueness estimates in measurement uncertainty evaluation (2nd ed). Geneva: ISO.
[7] International Organization for Standardization. (2019). ISO 19036: Microbiology of the food chain — Estimation of measurement uncertainty for quantitative determinations (1st ed). Geneva: ISO.
[8] International Organization for Standardization. (2017). ISO/IEC 17025: General Requirements for the Competence of Testing and Calibration Laboratories (3rd ed). Geneva: ISO.
[9] International Organization for Standardization. (2024). ISO 33405: Reference materials — Approaches for characterization and assessment of homogeneity and stability (1st ed). Geneva: ISO.
[10] International Organization for Standardization. (2011). ISO 376: Metallic materials — Calibration of force-proving instruments used for the verification of uniaxial testing machines (4th ed). Geneva: ISO.
[11] International Organization for Standardization. (2017). ISO 6789-2: Assembly tools for screws and nuts — Hand torque tools — Part 2: Requirements for calibration and determination of measurement uncertainty (1st ed). Geneva: ISO.
[12] ILAC Accreditation Committee. (2020). ILAC P14: ILAC Policy for Measurement Uncertainty in Calibration (3rd ed.). Silverwater: ILAC.
[13] National Institute of Standards and Technology. (2012). SEMATECH: Engineering Statistics Handbook. Gaithersburg: NIST.
[14] A2LA. (2024). R205 – Specific Requirements – Calibration Laboratory Accreditation Program. Frederick: A2LA
[15] EURAMET. (2022). Calibration Guide No. 4 – Guidelines on the Uncertainty of Force Measurements (3rd ed). Braunschweig: EURAMET e.V.
[16] Montgomery, D.C. (2009). Introduction to Statistical Quality Control (6th ed). Hoboken: John Wiley & Sons Inc.
[17] Taylor, John R. (1997). An Introduction to Error Analysis: The Study of Uncertainties in Physical Measurements (2nd ed.). Sausalito, CA: University Science Books.
[18] Castrup, H. (2007). Distributions for Uncertainty Analysis. Bakersfield: Integrated Sciences Group.
[19] Keysight Technologies. (2024). AN 1449-3: Fundamentals of RF and Microwave Power Measurements – Part 3: Power Measurement Uncertainty per International Guides. Santa Rosa: Keysight Technologies.
[20] European Accreditation. (2018). EA-4/21 INF: Guidelines for the assessment of the appropriateness of small interlaboratory comparisons within the process of laboratory accreditation. Paris: European Accreditation.
[21] Hogan, R. (2018). How to Start Every Uncertainty Analysis: Specify The Measurement Function And Create An Outline (1st ed). Williamsburg: ISOBudgets.
[22] Hogan, R. (2016). 15 Places to Find Uncertainty in Measurement (1st ed). Williamsburg: ISOBudgets.
[23] Hogan, R. (2023). 7 Sources of Uncertainty in Measurement for Every Uncertainty Budget (3rd ed). Williamsburg: ISOBudgets.
[24] Hogan, R. (2024). How to Perform a Repeatability Test for Estimating Uncertainty in Measurement (2nd ed). Williamsburg: ISOBudgets.
[25] Hogan, R. (2025). Reproducibility: What is it and How to Calculate it (1st ed). Williamsburg: ISOBudgets.
[26] Hogan, R. (2024). How to Calculate Stability for Uncertainty (1st ed). Williamsburg: ISOBudgets.
[27] Hogan, R. (2024). How to Calculate Drift Uncertainty (1st ed). Williamsburg: ISOBudgets.
[28] Hogan, R. (2016). How to Calculate Resolution Uncertainty (1st ed). Williamsburg: ISOBudgets.
[29] Hogan, R. (2019). How to Calculate Linearity Uncertainty (1st ed). Williamsburg: ISOBudgets.
[30] Hogan, R. (2019). How to Calculate Hysteresis for Your Uncertainty Budget (1st ed). Williamsburg: ISOBudgets.
[31] Hogan, R. (2019). How to Calculate Linear Thermal Expansion for Measurement Uncertainty (1st ed). Williamsburg: ISOBudgets.
[32] Hogan, R. (2025). Moist Air Density: What is it and How to Calculate it (1st ed). Williamsburg: ISOBudgets.
[33] Hogan, R. (2021). How to Calculate Air Buoyancy Correction with Examples (1st ed). Williamsburg: ISOBudgets.
[34] Hogan, R. (2022). Local Gravity: How to Calculate Yours in 3 Minutes (3rd ed). Williamsburg: ISOBudgets.
[35] Hogan, R. (2017). Type A and Type B Uncertainty: Evaluating Uncertainty Components (1st ed). Williamsburg: ISOBudgets.
[36] Hogan, R. (2024). Probability Distributions for Measurement Uncertainty (2nd ed). Williamsburg: ISOBudgets.
[37] Hogan, R. (2014). Combining Measurement Uncertainty Using the GUM Method (1st ed). Williamsburg: ISOBudgets.
[38] Hogan, R. (2015). Expanded Uncertainty And Coverage Factors for Calculating Uncertainty (1st ed). Williamsburg: ISOBudgets.
[39] Hogan, R. (2017). How to Calculate Sensitivity Coefficients for Measurement Uncertainty (1st ed). Williamsburg: ISOBudgets.
[40] Hogan, R. (2014). Propagation of Uncertainty Rules for Estimating Uncertainty (1st ed). Williamsburg: ISOBudgets.
[41] Hogan, R. (2021). Calculating Effective Degrees of Freedom (2nd ed). Williamsburg: ISOBudgets.
[42] Hogan, R. (2015). How to Calculate Normalized Error (1st ed). Williamsburg: ISOBudgets.
Change Log
| Date | Version | Description |
|---|---|---|
| 06/20/2015 | 1.0 | Original Issue |
| 06/20/2020 | 2.0 | Major update. Complete revision to expand content and update information |
| 11/17/2025 | 3.0 | Major update. Complete revision to expand content and update information |
{
“@context”: “https://schema.org”,
“@graph”: [
{
“@type”: “TechArticle”,
“headline”: “7 Steps to Calculate Measurement Uncertainty”,
“description”: “Learn a structured 7-step process to estimate measurement uncertainty including specifying the process, identifying and quantifying sources, characterising them, converting to standard deviations, combining them, applying a coverage factor and evaluating the result.”,
“datePublished”: “2025-11-17”,
“dateModified”: “2025-11-17”,
“author”: {
“@type”: “Person”,
“name”: “Richard Hogan”
},
“publisher”: {
“@type”: “Organization”,
“name”: “ISOBudgets”,
“logo”: {
“@type”: “ImageObject”,
“url”: “https://www.isobudgets.com/path/to/logo.png”
}
},
“mainEntityOfPage”: “https://www.isobudgets.com/7-steps-to-calculate-measurement-uncertainty/”,
“keywords”: [
“measurement uncertainty”,
“ISO/IEC 17025”,
“uncertainty calculation”,
“uncertainty budget”,
“combined standard uncertainty”,
“expanded uncertainty”
]
},
{
“@type”: “HowTo”,
“name”: “7-Step Process for Measurement Uncertainty”,
“description”: “Specify process → identify sources → quantify → characterise → convert → combine → expand → evaluate.”,
“step”: [
{“@type”:”HowToStep”,”name”:”Specify the measurement process and equation”,”text”:”Select test or measurement function, method, equipment, range, test-points.”},
{“@type”:”HowToStep”,”name”:”Identify sources of uncertainty”,”text”:”List all contributors from method, equipment, environment, etc.”},
{“@type”:”HowToStep”,”name”:”Quantify uncertainty components”,”text”:”Collect data, analyse, assign magnitude to each uncertainty source.”},
{“@type”:”HowToStep”,”name”:”Characterise sources”,”text”:”Decide Type A vs Type B; assign probability distribution.”},
{“@type”:”HowToStep”,”name”:”Convert to standard deviations”,”text”:”Use distribution-specific divisor to convert each u component to standard uncertainty.”},
{“@type”:”HowToStep”,”name”:”Calculate combined standard uncertainty”,”text”:”Use root-sum-of-squares method to combine u components.”},
{“@type”:”HowToStep”,”name”:”Calculate expanded uncertainty”,”text”:”Select a coverage factor (k) and multiply by combined standard uncertainty.”},
{“@type”:”HowToStep”,”name”:”Evaluate the uncertainty budget”,”text”:”Check significance of contributors; compare expanded uncertainty vs reference standard, other labs, etc.”}
]
}
]
}


13 Comments