Introduction
With the ISO/IEC 17025 standard’s focus on risk in measurement decisions (i.e. decision rules), you should consider evaluating conformance probability.
Have you ever wondered, “What is the chance that this measurement is in tolerance or out of tolerance?”
No matter how great your measurement system is, results near tolerance limits make you think about the above question. Many people press the “I believe” button and move on. However, this approach can be costly for both your laboratory and it’s customers.
By calculating conformance probability and evaluating the results, you could:
- Determine the specific risk for a particular test or measurement result, and(or)
- Optimize your decision rules to control the risk in your measurement decisions.
In this guide, I am going to teach you all about conformance probability. You will learn the following:
- What is Conformance Probability
- Why is Conformance Probability Important
- How to Calculate Conformance Probability
- What is the Probability of False Acceptance
- How to Calculate the Probability of False Acceptance
- What is the Probability of False Rejection
- How to Calculate the Probability of False Rejection
- Risk in Measurement Decisions
- Measurement Risk and Decision Rules
Click any of the above links to jump ahead to any section in this guide.
What is Conformance Probability
According to the JCGM 106:2012, conformance probability is the probability that an item fulfills a specified requirement.

In simple terms (for laboratories), it is the chance or likelihood that your test or calibration result is within specifications or tolerances.
On a scale of zero to 100 %, a conformance probability is interpreted as:
- probabilities closer to 100 %, the higher the chance that your result conforms to specifications,
- probabilities at 50 % are at the tolerance limit, and
- probabilities closer to 0 %, the higher the chance that your result does not conform to specifications.
In the below image, you see a:
- measurement result with its associated expanded uncertainty (i.e. blue normal distribution) and
- tolerance interval with upper and lower tolerance limit (i.e. black lines).
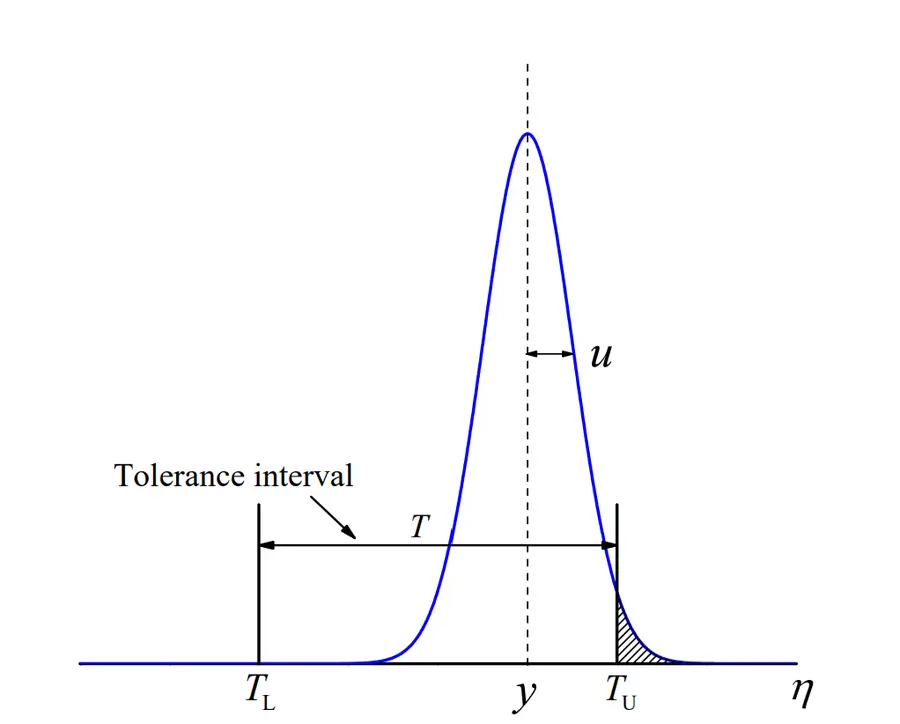
Looking at the above image, you will notice that the measurement result and its expanded uncertainty overlap the upper tolerance limit. Now, depending on your decision rules, this result could be a:
- Pass,
- Conditional Pass, or
- Fail
If your decision rules allow for the result to Pass or Conditional Pass, then you may want to know the likelihood that the result is actually in tolerance. This is where you can use conformance probability to help evaluate the risk associated with your results, including:
- Risk of False Acceptance (i.e. consumer’s risk), and
- Risk of False Rejection (i.e. producer’s risk).
Why is Conformance Probability Important
If you think calculating conformance probability is another useless evaluation, you are wrong!
While most people focus on Test Uncertainty Ratio, it does not address the specific risk associated with measurement decisions. Alternatively, conformance probability provides you with the risk associated with your measurements and decision rules. This can help you make a more informed decision.
In the above image, you will see the result y is within the tolerance interval T, but the expanded uncertainty of u overlaps the upper tolerance limit.
Now, the result is within the tolerance interval; but the expanded uncertainty overlaps the tolerance limit. Therefore, there is a chance that the measurement result does not conform to specifications.
If your decision rules are based on simple acceptance, then this result passes. However, what is the probability this result passed and what is the risk of a type II error (i.e. probability of false acceptance).
If your decision rules are based on simple acceptance, then this result passes. However, what is the probability this result passed and what is the risk of a type II error (i.e. probability of false acceptance).
If you use a binary decision rule with guard banding, then this result might fail if it exceeds the acceptance limit (i.e. tolerance limit plus or minus a multiple of the expanded measurement uncertainty). It would be helpful to know the conformance probability and the risk of a type I error (i.e. probability of false rejection).
Evaluating these scenarios can be extremely valuable! Knowing the risks associated with the laboratory (i.e. producer’s risk) and it’s customers (i.e. consumer’s risks) can help you determine an optimized set of decision rules that benefit both parties.
How to Calculate Conformance Probability
Calculating conformance probability can differ based on the test or measurement scenario.
In this section, I will show you how to calculate conformance probability for the following types of measurement scenarios:
- Two-sided tolerance interval (most common),
- One-sided lower tolerance limit, and
- One-sided upper tolerance limit.
A. Two-sided tolerance intervals with normal PDFs

Two-sided tolerance intervals are the most common test or measurement scenario you will encounter.
A two-sided tolerance interval means that you have an upper and lower limit. The above image shows an example of a two-sided tolerance interval.
You will notice that there is an upper and lower tolerance limit. The space in between the limits is the tolerance interval. Furthermore, you will see a normal distribution where y is the result and u is the standard uncertainty (not the expanded uncertainty).
Formula
The below formula can be used to calculate conformance probability for a Two-sided tolerance interval with a normal distribution. You will notice the formula requires that you know the tolerance limits, result, and standard uncertainty associated with the result.

TUL = Upper Tolerance Limit
TLL = Lower Tolerance Limit
y = Test or Measurement Result Value
u = Standard Measurement Uncertainty (68% C.I., k=1)
Instructions
Since statistics is not everyone’s favorite task, let me show you how to easily calculate this in Microsoft Excel.
To calculate the conformance probability for a two-sided tolerance interval, follow the below instructions:
- Determine the upper and lower tolerance limits,
- Determine the test or measurement result,
- Determine the measurement uncertainty associated with the result,
- Convert the expanded uncertainty to a standard uncertainty (typically, divide U95 by 2),
- Then, use the following function in Microsoft Excel:
IMPORTANT: Make sure all quantities are in the same unit of measurement and same level of magnitude. Otherwise, you will get erroneous results.
B. One-sided tolerance intervals with normal PDFs
One-sided tolerances are not as common as two-sided tolerances, but they do occur for many types of test and measurement results. Therefore, you need to know how to calculate the probability of conformance for these scenarios.
In this section, I will show you how to calculate it for both of the following:
- Single lower tolerance limit, and
- Single upper tolerance limit.
B.1. Single Lower Tolerance Limit
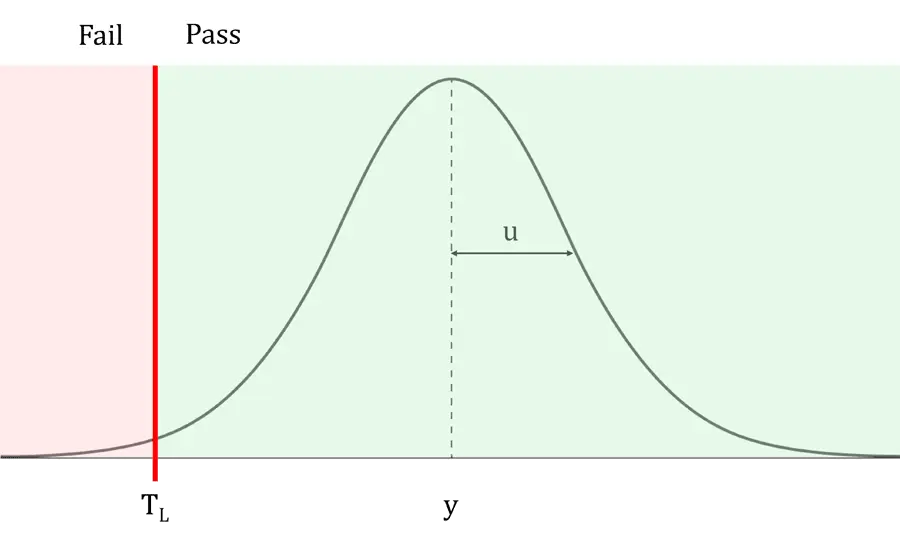
For a single lower tolerance limit, the result must be greater than the tolerance limit to get a conforming result, such as:
- Pass,
- In Tolerance,
- Within Specification,
- Etc.
Now, what happens when the measurement result and it’s associated uncertainty overlaps the tolerance limit?
In the above image, you will notice that the measurement uncertainty interval overlaps the tolerance limit. Depending on your laboratory’s decision rules, does this result Pass or Fail?
If you wanted to evaluate the risk associated with your decision rules, calculate the conformance probability. This will give you the percent chance that your result conforms to specification which may help you make a better measurement decision.
Formula
The below formula can be used to calculate the conformance probability for a single lower tolerance limit.

TL = Lower Tolerance Limit
y = Test or Measurement Result Value
u = Standard Measurement Uncertainty (68% C.I., k=1)
Instructions
To calculate the conformance probability for a one-sided tolerance interval with a lower tolerance limit, follow the below instructions:
- Determine the lower tolerance limit,
- Determine the test or measurement result,
- Determine the measurement uncertainty associated with the result,
- Convert the expanded uncertainty to a standard uncertainty (typically, divide by 2),
- Then, use the following function in Microsoft Excel:
IMPORTANT: Make sure all quantities are in the same unit of measurement and same level of magnitude. Otherwise, you will get erroneous results.
B.2. Single Upper Tolerance Limit
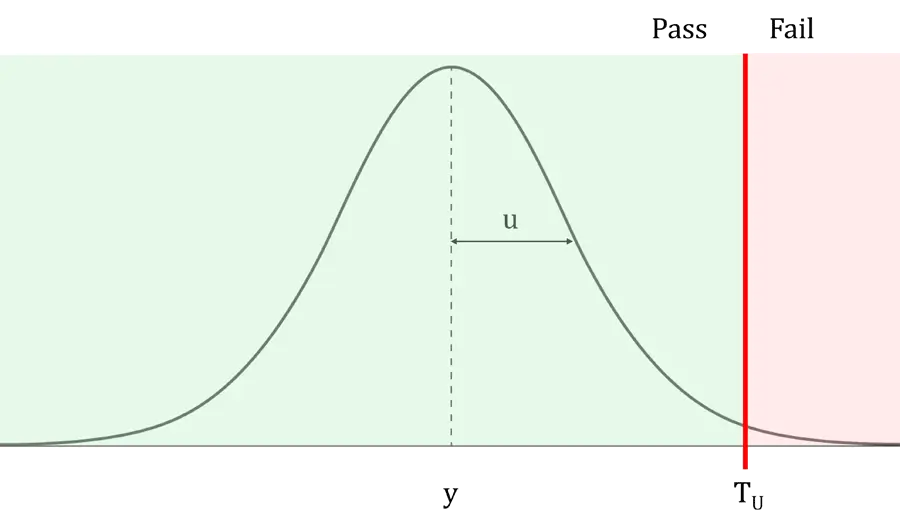
For a single upper tolerance limit, the result must be less than the tolerance limit to get a conforming result, such as:
- Pass,
- In Tolerance,
- Within Specification,
- Etc.
Now, what happens when the measurement result and it’s associated uncertainty overlap the tolerance limit?
In the above image, you will notice that the measurement uncertainty interval overlaps the upper tolerance limit. Depending on your laboratory’s decision rules, does this result Pass or Fail?
If you calculate the conformance probability, you can evaluate the risk associated with your decision rules. This will give you the percent chance that your result conforms to specification which may help you make a better measurement decision.
Formula
The below formula can be used to calculate the conformance probability for a single upper tolerance limit.

TL = Upper Tolerance Limit
y = Test or Measurement Result Value
u = Standard Measurement Uncertainty (68% C.I., k=1)
Instructions
To calculate the conformance probability for a one-sided tolerance interval with an upper tolerance limit, follow the below instructions:
- Determine the upper tolerance limit,
- Determine the test or measurement result,
- Determine the measurement uncertainty associated with the result,
- Convert the expanded uncertainty to a standard uncertainty (typically, divide by 2),
- Then, use the following function in Microsoft Excel:
IMPORTANT: Make sure all quantities are in the same unit of measurement and same level of magnitude. Otherwise, you will get erroneous results.
What is Probability of False Acceptance
According to the JCGM 106, the Probability of False Acceptance (PFA) or specific consumer’s risk is the probability (i.e. chance) that a particular accepted item is non-conforming.

Essentially, it means that an item Passed a test or calibration when there is a chance it could have Failed.
This is known as consumer’s risk because these types of nonconformities (mostly) impact your customer and their subsequent tests, calibrations, and(or) measurements.
The general consensus is false acceptances should be avoided over false rejections due to potential catastrophic impacts it can have on quality, safety, health, and life (i.e. death).
How to Calculate Probability of False Acceptance
Many people calculating the conformance probability also want to know the probability of nonconformance or the probability of false acceptance (PFA).
After calculating the conformance probability, it is easy to calculate the probability of false acceptance.
Formula
The below formula can be used to calculate the conformance probability of false acceptance.

pc = Non-Conformance Probability
pc = Conformance Probability
Instructions
To calculate the probability of false acceptance, follow the below instructions:
- Determine the conformance probability,
- Subtract the conformance probability from one (i.e. one minus the conformance probability).
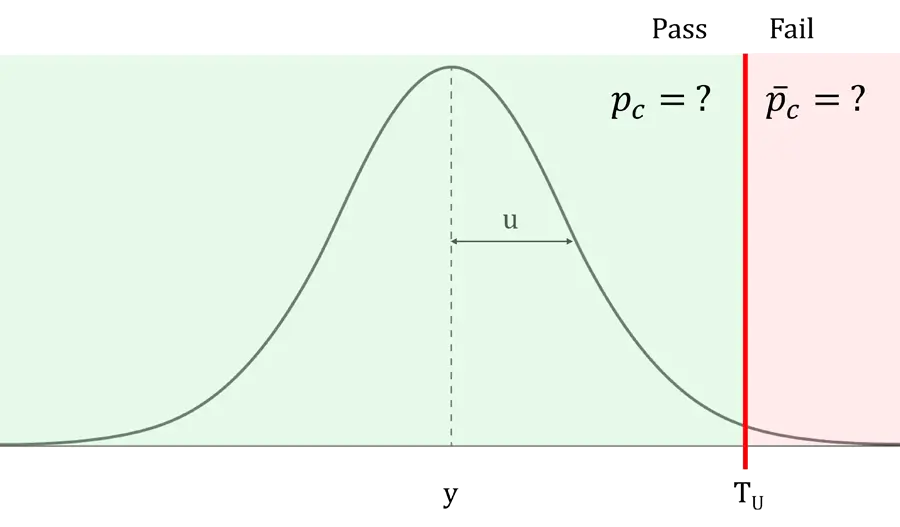
What is Probability of False Rejection
According to the JCGM 106, the Probability of False Rejection (PFR) or specific producer’s risk is the probability (i.e. chance) that a particular rejected item is conforming.

Opposite to false acceptance, false rejection means an item Failed a test or calibration when it should have Passed.
This is known as producer’s risk because these type of nonconformities impact your laboratory and the tests, calibrations, and(or) measurements it performs.
How to Calculate Probability of False Rejection
Although it is less popular, some people want to know how to calculate the probability of false rejection (PFR).
To do this, just calculate the probability of conformance (from the previous sections).
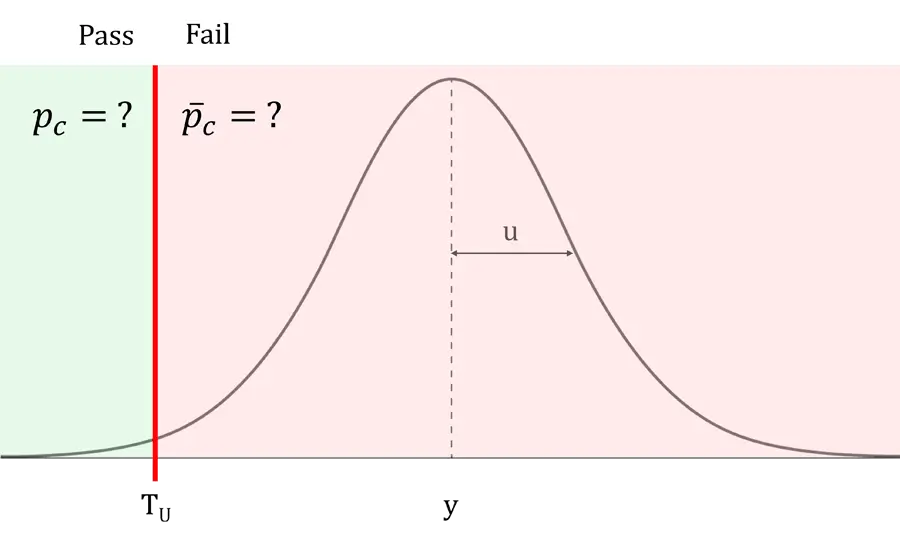
However, you may not want to consider PFR until your result y has exceeded an acceptance limit (AL) or tolerance limit (TL).
If the measurement uncertainty interval overlaps the tolerance or acceptance limit (see the below image), then there is a change that the result is actually in tolerance or Passes.
If you use simple acceptance decision rules, then the result is out of tolerance or Fails when the result exceeds the tolerance limits.
If you use binary decision rules with guard banding, then the result is out of tolerance or Fails then the result exceeds the acceptance limits.
No matter the type of decision rule you use, just calculate the probability of conformance to determine the probability of false rejection.
Risk in Measurement Decisions
Now that you know about the probability of conformance, false acceptance, and false rejection; you may be wondering, “How does this affect my test or calibration results?”
Well, let’s take a look at these probabilities compared with test uncertainty ratio (i.e. measurement capability index) and percentage of tolerance limit.
If you need to learn more about test uncertainty ratio, click the link below.
Otherwise, use the information and charts below to help you determine what type of decision rules your lab should use.
In below sections, you learn more about the following:
- Probability of Conformity vs Test Uncertainty Ratio and Tolerance Limit,
- Probability of False Acceptance vs Test Uncertainty Ratio and Tolerance Limit, and
- Probability of False Rejection vs Test Uncertainty Ratio and Tolerance Limit.
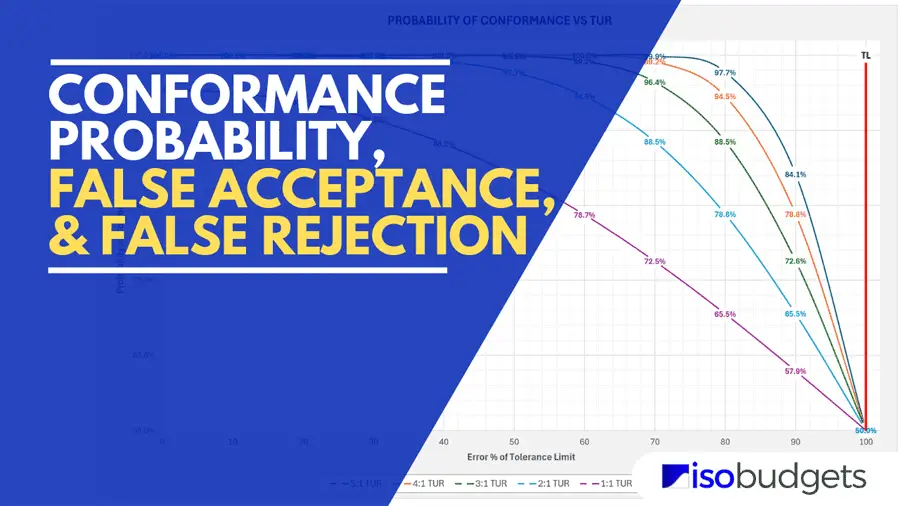
Probability of Conformance vs Test Uncertainty Ratio and Tolerance Limit
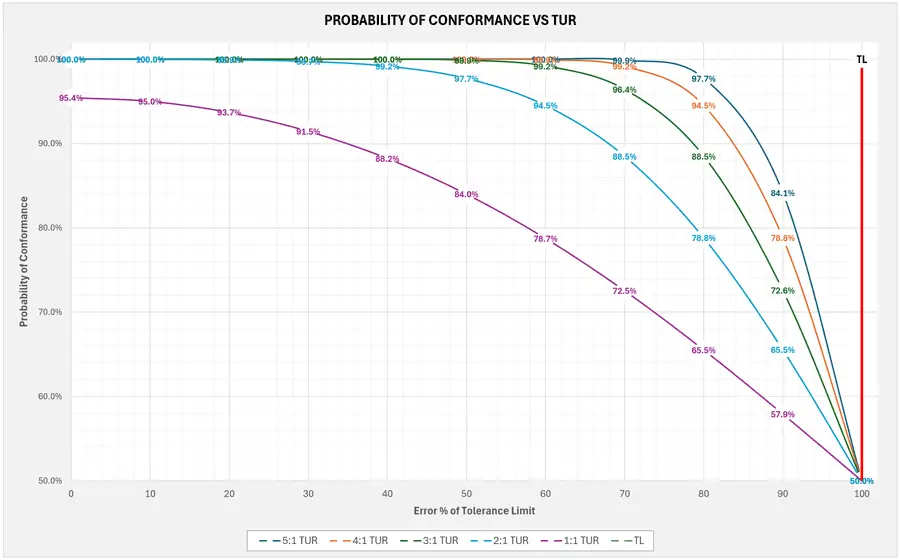
In the below chart, I have plotted the probability of conformance versus the percentage error of the tolerance limit. Each line in the graph represents the conformance probability based on test uncertainty ratio and how close the result is to the tolerance limit.
On the right side of the chart, you will see a red, vertical line. This is the tolerance limit; and, when the result is equal to the tolerance limit, the probability of conformance is 50%.
Otherwise, you will find the conformance probabilities when your results are between zero error and the tolerance limit.
When the result is inside of the tolerance limit, it is typically considered to pass or conform to specifications. The below chart provides the likelihood that the result passes or conforms to specifications.
Notice how the probability of conformance decreases as the result approaches the tolerance limit. Furthermore, notice how the probability decreases as the TUR decreases.
Therefore, you can see that results with a higher test uncertainty ratio will generally have a higher probability of conformance.
In the chart, I covered TURs between 1:1 and 5:1. Most people aim for a 4:1 TUR even though it is not always possible. Additionally, some ISO methods require a 5:1 TUR while some ASTM methods require a 3:1 TUR. So, I tried to cover many of the common of goals and requirements that lab typically aim to meet.
Probability of False Acceptance vs Test Uncertainty Ratio and Tolerance Limit
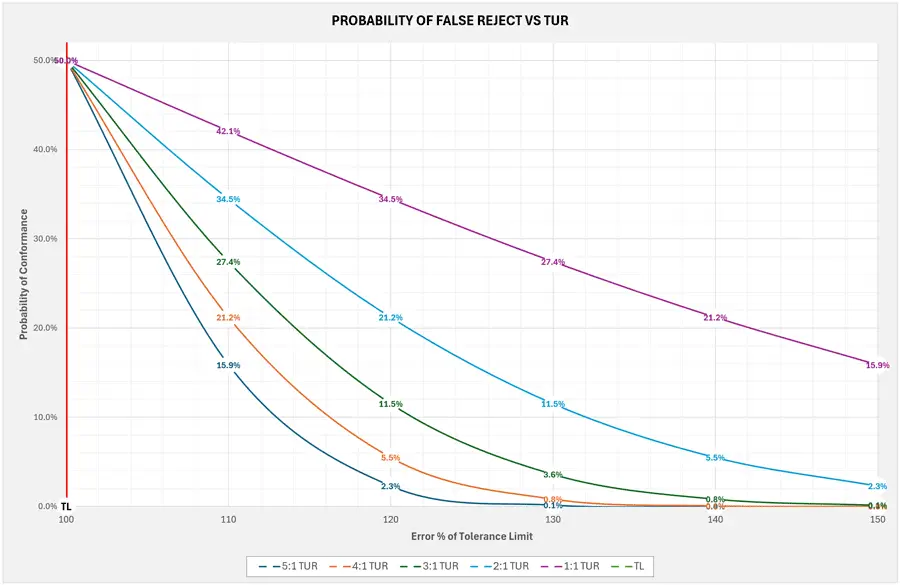
Next, I created a chart that plotted the probability of false acceptance versus the percentage error of the tolerance limit. Each line in the graph represents the probability of false acceptance based on test uncertainty ratio and how close the result is to the tolerance limit.
On the right side of the chart, you will see a red, vertical line. This is the tolerance limit. When the result is equal to the tolerance limit, the probability of false acceptance is 50%.
Otherwise, you can look at the chart to find the probability of false acceptance when your results are between zero error and the tolerance limit.
When the result is inside of the tolerance limit, it is typically considered to pass or conform to specifications. The below chart provides the risk of a false acceptance decision or a Type II error.
Notice how the probability of false acceptance increases as the result approaches the tolerance limit. Furthermore, notice how the probability increases as the TUR decreases.
Therefore, you can see that results with a higher test uncertainty ratio will generally have a smaller probability of false acceptance.
In the chart, I covered TURs between 1:1 and 5:1. Most people aim for a 4:1 TUR even though it is not always possible. For reference, some ISO methods require a 5:1 TUR while some ASTM methods require a 3:1 TUR. So, I tried to cover many of the common of goals and requirements that lab typically aim to meet.

Probability of False Rejection vs Test Uncertainty Ratio and Tolerance Limit
Finally, I created a chart that plotted the probability of false rejection versus the percentage error of the tolerance limit. Each line in the graph represents the probability of false rejection based on test uncertainty ratio and how far the result is outside of the tolerance limit.
On the left side of the chart, you will see a red, vertical line. This is the tolerance limit. When the result is equal to the tolerance limit, the probability of false rejection is 50%.
Otherwise, you can look at the chart to find the probability of false rejection when your results are outside of the tolerance limit.
When the result is outside of the tolerance limit, it is typically considered to fail or not conform to specifications. The below chart provides the risk of a false rejection decision or a Type I error.
Notice how the probability of false rejection decreases as the result moves further away from the tolerance limit. Furthermore, notice how the probability increases as the TUR decreases.
Therefore, you can see that results with a higher test uncertainty ratio will generally have a smaller probability of false rejection.
Risk and Decision Rules
Now that you see the risks in your measurement results, you can evaluate your decision rules to determine what works best for your laboratory and its customers.
Simple Acceptance Decision Rules
Simple acceptance decision rules are very popular. However, there are many professionals that do not like or approve the use of simple acceptance.
Organizations, such as UKAS and A2LA, have published bulletins and guidance documents to control the use of simple acceptance decision rules. You can click the links below to access them.
- UKAS LAB 48: Decision rules and statements of conformity
- A2LA G136: Guidance on Decision Rules in Calibration
If you use simple acceptance decision rules, then your probability of false acceptance can be as high as 50%.
This is one of the arguments opponents use to express their dissatisfaction for these decision rules; the PFA risk is too large. Another argument is simple acceptance does not directly take uncertainty or risk into account in accordance with ISO/IEC 17025.
Regardless of your opinion on the matter, the ILAC G8 still has simple acceptance binary decision rules in it and it is a matter that must be communicated and agreed upon (between the laboratory and its customer) as part of contract review per ISO/IEC 17025.
My only recommendation on the matter is do not state (in your decision rules) that “measurement uncertainty is not taken into account.” It is not consistent with ILAC G8 guide.
So you are aware of the risks, I have created a table.
In the image below, you will see table that shows the probability of conformance and the probability of false acceptance compared to the error percentage of tolerance limit. The results are segmented by test uncertainty ratio.
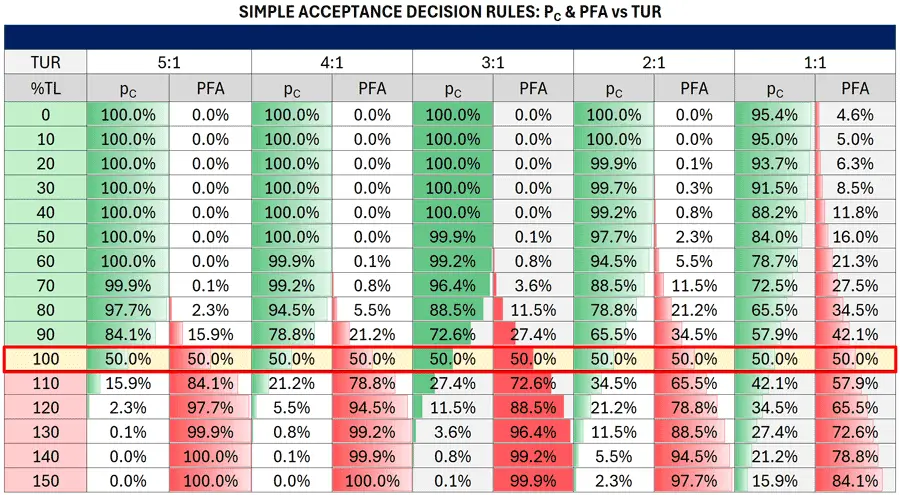
Notice the conformance probability decreases and the probability of false acceptance increases as the result gets closer to the tolerance limit (i.e. 100 %TL).
The tolerance limit is 100 % of the tolerance limit (i.e. 100 %TL) shown in the left-most column in the table. The probabilities are grouped by test uncertainty ratio which you can see in the top row. Then, the probabilities of conformance and false acceptance are given for results ranging from 0 % to 150 % of the tolerance limit.
Now, you will notice I added a red, rectangle to the table to show the probability of conformity and false acceptance at the tolerance limits. With simple acceptance decision rules, the tolerance limit is not guard banded. So, the acceptance limits equal the tolerance limits.
Therefore, you can see that you have 50%/50% risk when the result is at the tolerance limit.
Binary Decision Rules with Guard Banding
Binary decision rules with guard banding are also popular, but not as common as simple acceptance. Guard banding is the most recommended method (by professionals) of taking measurement uncertainty account.
There are a lot of different guard banding methods, but the most popular are the:
- ILAC G8 method, and
- ISO 14253-1 method
To see other guard banding methods, check out my guide using the link below:
If you use binary decision rules with guard banding, then your probability of false acceptance will be significantly less compared with simple acceptance decision rules.
So you are aware of the reduction in risk associated with guard banding, I have created a table.
In the image below, you will see a table with the probability of conformity and false acceptance compared to the error percentage of tolerance limit. Also, the results are segmented by test uncertainty ratio.
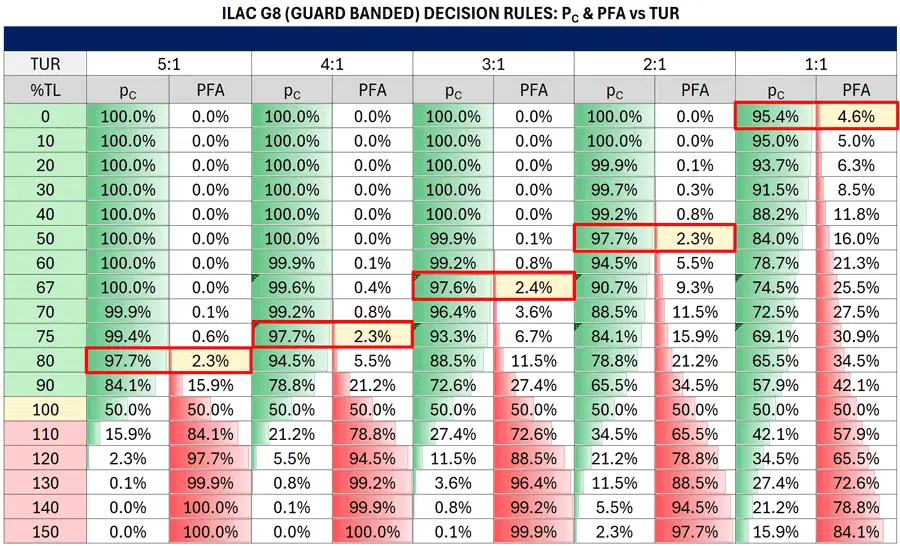
Notice how the conformance probability decreases and the probability of false acceptance increases as the result gets closer to the tolerance limit (i.e. 100 %TL).
The tolerance limit is 100 % of the tolerance limit (i.e. 100 %TL) shown in the left-most column in the table. The probabilities are grouped by test uncertainty ratio which you can see in the top row. Then, the probabilities of conformance and false acceptance are given for results ranging from 0 % to 150 % of the tolerance limit.
Now, look at the red, rectangles I added to the table. These show the probability of conformity and false acceptance at the acceptance limits (which are highlighted yellow), not the tolerance limits.
Since the tolerance limits are guard banding by the expanded uncertainty, the:
- acceptance limits are less than the tolerance limits, and
- the probability of false acceptance is significantly reduced.
The probability of false acceptance is reduced from 50% to 2.3 % for test uncertainty ratios greater than 2:1. When the test uncertainty ratio is equal to 1:1, the PFA is 4.6 %; still a significant reduction from 50%.
However, the probability of false rejection may be too large for some laboratories. If this is the case, you should look into other guard banding methods and find one that matches your risk tolerance.
Depending on your laboratory’s activities, you can evaluate your activities on a case-by-case basis and have more than one set of decision rules. It is not common, but there are some laboratories that use this method.
Conclusion
Considering the risk in your measurement results is important. More so today, since most ISO/IEC 17025 accredited laboratories must have decision rules.
Evaluating conformance probability in your test or measurement results can help you determine:
- What decision rules are best for your laboratory and its customers
In this guide, you should have learned the following:
- What is Conformance Probability
- Why is Conformance Probability Important
- How to Calculate Conformance Probability
- Two-sided Tolerance Interval
- Single Lower Tolerance Interval
- Single Upper Tolerance Interval
- What is the Probability of False Acceptance
- How to Calculate the Probability of False Acceptance
- What is the Probability of False Rejection
- How to Calculate the Probability of False Rejection
- Risk in Measurement Decisions
- Risk and Decision Rules
If you use the information in this guide to calculate conformance probability, probability of false acceptance, and probability of false rejection, then you should be able to determine an optimized set of decision rules that work for your laboratory and its customers.
Otherwise, you can stick with recommended practices. However, do you know and accept the risks associated with your decision rules?