When performing experiments, we expect to achieve an approximation of confidence in the results of our observations. When our confidence is high, we typically expect our risk of failure to be low. Therefore, it is important to understand the importance of confidence and risk when estimating the uncertainty in our measurement results.

What is a confidence interval?
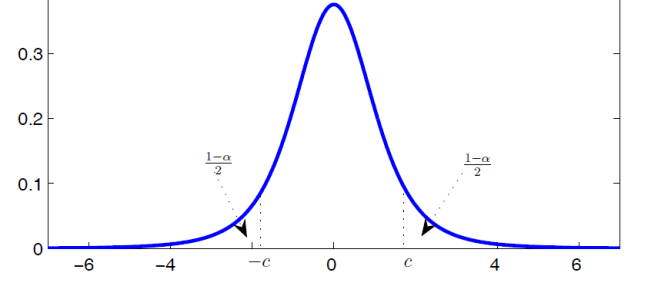
A confidence interval is an estimated range for a population parameter in which an event (e.g. measurement, sample, trial, or observation) is corresponding to a given probability.
What does that mean?
If we were to repeatedly sample the same population, the observations would conform to the probability parameters established by the confidence interval.
Common confidence intervals
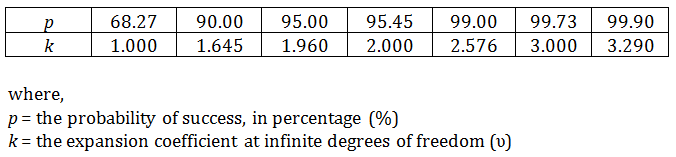
In Metrology, it is common to estimate measurement uncertainty to a confidence level of 95.45%, where k is equivalent to 2. In fact, it is required by the ILAC-P14:01/2013 policy, section 5.3, that calibration laboratories express their measurement uncertainty estimates to a coverage probability of approximately 95%.
The table below exhibits some of the most common confidence intervals, and their respective expansion factor, used amongst various industries.
Risks associated with confidence intervals
Every decision is made with an acceptance of associated risk. When selecting which confidence interval to use, consider the risks associated with the given confidence interval. The best way to evaluate risk, in this situation, is to observe the probability of failure (q) and the rate at which failure occurs.
The table below exhibits the respective probabilities and rates of failure for each confidence interval.
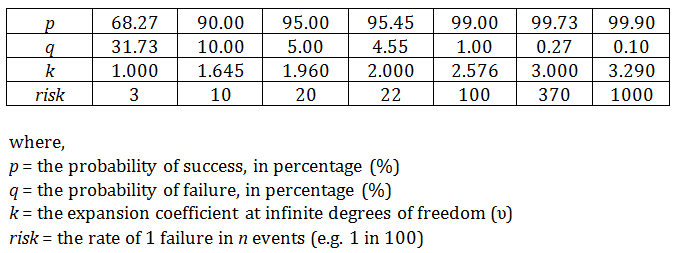
From the table, you should be able to deduce that a 95.45% confidence interval carries the risk of failure to a probability of 4.55%. Similarly, it is associated with an expected rate of failure to 1 failure in 22 observations.
Is this confident enough to ensure repetitive quality on a large scale?
The probability of failure at 4.55% may seem marginal; but, for a laboratory that performs one million measurements each year, the number of nonconformities (45,455) may not seem so marginal. For this reason, it is important to consider the risks involved with your measurement results.