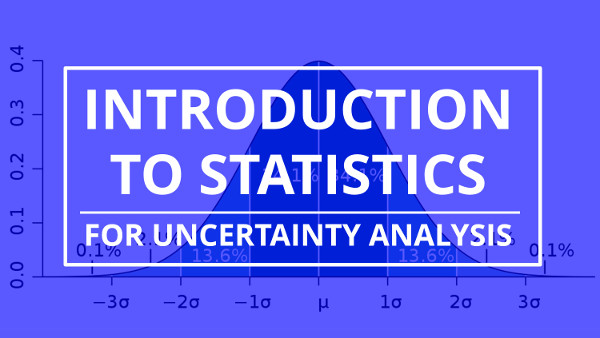
Introduction to Statistics
Estimating uncertainty in measurement requires a good understanding of Statistics and statistical analysis. While there are many free statistics resources online, no one has created a statistics guide specifically for the estimation of uncertainty in measurement.
In this article, I have compiled a comprehensive list of the statistical functions to help you calculate uncertainty in measurement and evaluate your results. This guide will teach you the definition, equation, and instructions to calculate each statistical function. Plus, I have included some statistical principles and rules to help you evaluate your results.
Background
When I began to calculate uncertainty, I used to constantly refer to several college textbooks for statistical functions to analyze data. Some of my favorite statistics textbooks include;
•Statistics for Engineering and the Sciences by Mendenhall and Sincich
•Introduction to Statistical Quality Control by Douglas Montgomery
•Statistics for Experimenters by Box, Hunter, and Hunter
I used college textbooks because they were the only resource available to evaluate measurement uncertainty calculations.
Over the years, I have used these textbooks so much that I now know these functions by heart. Therefore, I thought that it would be a great idea to create an Introduction to Statistics for Uncertainty Analysis guide for you.
Each one of the statistical functions listed in this guide have a specific purpose. Some functions are used to estimate uncertainty and others are used to evaluate the results.
I believe that I have created a great introduction to statistics guide to calculate uncertainty and evaluate your results. If I have left anything out, feel free to recommend additional functions.
Below is a list of statistical functions included in this guide. Just click on the function that you want to learn more about.
Average
Variance
Standard Deviation
Determining Sample Size
Degrees of Freedom
Sum of Squares
Root Sum of Squares
Pooled Variance
Effective Degrees of Freedom
Linear Interpolation
Linear Regression
Sensitivity Coefficient
Covariance
Correlation
Correlation Coefficient (R)
Coefficient of Determination (R2)
Central Limit Theorem
Standard Deviation of the Mean
Confidence Intervals
Z-Score
T-Score
Student’s T Distribution
Probability Distributions
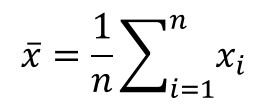
Average
When you need to know the central value of your sample data set, you will want to calculate the average or mean value. It can be used to predict the expected value of future measurement results.
Definition
The central number of set of numbers that is calculated by adding quantities together and then dividing the total number of quantities.
Equation
How to Calculate
1. Add all the values together.
2. Count the number of values.
3. Divide step 1 by step 2.
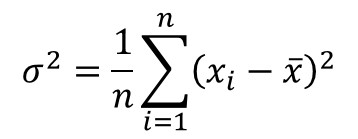
Variance
When you want to know how spread out the data in your sample set is, you will want to calculate the variance.
Definition
A measurement of the Spread between numbers in a data set.
Equation
How to Calculate
1. Subtract each value by the mean.
2. Square each value in step 1.
3. Add all of the values from step 2.
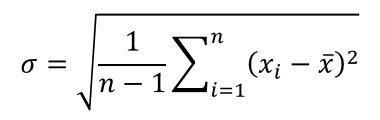
Standard Deviation
When you are analyzing a set of data and need to know the average random variability, you want to use the standard deviation equation. It is one of the more common descriptive statistics functions used to calculate uncertainty.
Definition
A measure of the dispersion of a set of data from its mean (i.e. average).
Equation
How to Calculate
1. Subtract each value from the mean.
2. Square each value in step 1.
3. Add all of the values from step 2.
4. Count the number of values and Subtract it by 1.
5. Divide step 3 by step 4.
6. Calculate the Square Root of step 5.
Determining Sample Size
Have you ever wanted to reduce the magnitude of your standard deviation? Well, if you know how small you want the standard deviation to be, you can use this function to tell you how many samples you will need to collect to achieve your goal.
Definition
The number of samples required to obtain a desired margin of error.
Equation
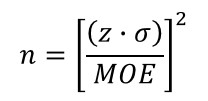
How to Calculate
1. Choose your desired confidence level (z).
2. Choose your desired margin of error (MOE).
3. Multiply the result of step 1 by the value by standard deviation of the sample set.
4. Divide the result by the margin of error selected in step 2.
5. Square the result calculated in step 4.
Degrees of Freedom
When you want to determine the significance of statistical estimates, such as mean, standard deviation, etc, it is important to calculate the degrees of freedom. Furthermore, degrees of freedom is commonly used to estimate confidence intervals.
Definition
The number of values in the final calculation of a statistic that are free to vary.
Equation
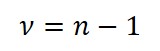
How to Calculate
1. Count the number of values in the sample set.
2. Subtract the value in step 1 by 1.
Sum of Squares
When you need to know the total variation attributed by various factors, the sum of squares is an important function to use. It is commonly used in regression analysis to evaluate the residual error of a model.
Definition
The sum of the squared errors, uncertainties, and(or) tolerances.
Equation
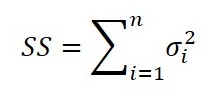
How to Calculate
1. Square each value in the sample set.
2. Add all the values in step 1.
Root Sum of Squares
Need to calculate the total variation of several uncorrelated influences for uncertainty, error, or tolerance analysis? Then, the root sum of squares (i.e. RSS) method should be your preferred statistical function.
Definition
The Square Root of the sum of the squared errors, uncertainties, and(or) tolerances.
Equation
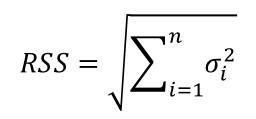
How to Calculate
1. Square each value in the sample set.
2. Add all the values in step 1.
3. Calculate the Square Root of the value in step 2.
Pooled Variance
Sometimes you need to find the average of several calculated standard deviations. Well, you cannot approximate the average standard deviation by using the average function. It is mistake I see people make all the time.
Instead, you should use the method of pooled variance.
Definition
The Estimation of Variance for multiple populations, each with their own mean and standard deviation.
Equation
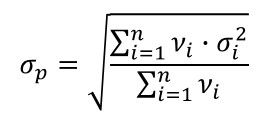
How to Calculate
1. Square each value in the sample set.
2. Multiply each value in step 1 by its degrees of freedom.
3. Add all the values in step 2.
4. Add all the degrees of freedom.
5. Divide the value in step 3 by the value in step 4.
6. Calculate the Square Root of the value in step 5.
Effective Degrees of Freedom
Want to use the Student T Distribution to find you coverage factor? Use the Welch-Satterthwaite equation to approximate your effective degrees of freedom.
Definition
The Approximated Degrees of Freedom for a variable approximated by the t-distribution.
Equation
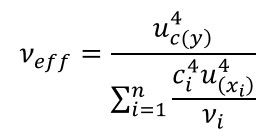
How to Calculate
1. Calculate the combined uncertainty Raised To The Power of 4.
2. Calculate the sensitivity coefficient Raised To The Power of 4.
3. Calculate the standard uncertainty Raised To The Power of 4.
4. Multiply the results of step 2 and step 3.
5. Divide the results of step 4 by it’s associated degrees of freedom.
6. Repeat steps 2 through 5 for each sensitivity coefficient and standard uncertainty value.
7. Add all the results from step 5.
8. Divide the result of step 1 by the result of step 7.
Linear Interpolation
Want to calculate equations for your CMC uncertainty? Use linear interpolation to develop a prediction equation to estimate the measurement uncertainty between two points of a measurement function.
Definition
The Estimation of new data points in a range between two known data points.
Equation
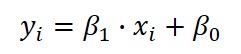
Where,
How to Calculate
1. Find the Maximum and Minimum known points for x and y.
a. Assign the maximum value of y as y2.
b. Assign the minimum value of y as y1.
c. Assign the maximum value of x as x2.
d. Assign the minimum value of x as x1.
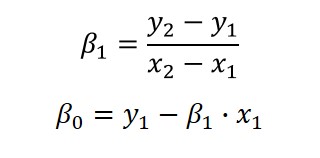
2. Calculate the Gain Coefficient: B1
a. Subtract the result of y2 by the result of y1.
b. Subtract the result of x2 by the result of x1.
c. Divide the result of step 2a by the result of step 2b.
3. Calculate the Offset Coefficient: B0
a. Multiply the result of step 2c by the result of x1.
b. Subtract the mean of y by the result calculated in step 2a.
4. Verify your results.
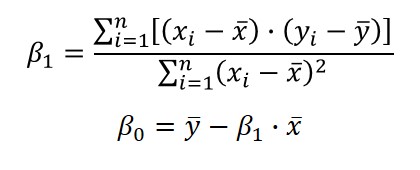
Linear Regression
Need to find a prediction model for your CMC uncertainty using more than two data points, you will want to use linear regression to find more accurate linear equation.
Definition
A procedure for Estimating The Relationship between a dependent variable (y) and one or more independent variables (x) for a given population.
Equation
Where,
How to Calculate
1. Calculate the Gain Coefficient: B1
a. Calculate the mean (i.e. average) of x.
b. Calculate the mean (i.e. average) of y.
c. Subtract the value of x by the mean (i.e. average) of x.
d. Subtract the value of y by the mean (i.e. average) of y.
e. Multiply the result of step 1c by the result of step 1d.
f. Repeat steps 1c through 1e for each value of x and y in the sample set.
g. Add all the results calculated in step 1f.
h. Subtract the value of x by the mean (i.e. average) of x.
i. Square the result of step 1h.
j. Repeat steps 1h and 1i for each value of x in the sample set.
k. Add all the results calculated in step 1j.
l. Divide the result of step 1g by the result of step 1k.
2. Calculate the Offset Coefficient: B0
a. Multiply the result of step 1l by the mean (i.e. average) of x.
b. Subtract the mean of y by the result calculated in step 2a.
3. Verify your results.
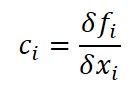
Sensitivity Coefficient
When estimating uncertainty with different units of measure, using sensitivity coefficients is great option to make the process easier. Simply, sensitivity coefficients will convert your uncertainty influences to similar units of measurement before calculating combined uncertainty.
Definition
A factor that correlates the Relationship between an individual variable (i.e. uncertainty contributor) and the affect it has on the final result.
Equation
How to Calculate
1. Identify the equation or function that will define the value of variable y.
2. Choose two different values (e.g. max and min) for the variable x.
3. Calculate the result of the variable y for each value of the variable x.
4. Subtract the results of the variable y (i.e. y2 – y1).
5. Subtract the results of the variable x (i.e. x2 – x1).
6. Divide the result of step 4 by the result of step 5.
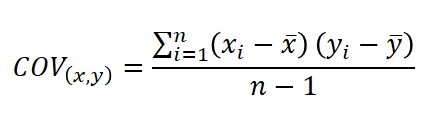
Covariance
When you want to know how much influence a variable has on the result of an equation, you should use the covariance function to evaluate the strength of correlation.
Definition
A measure of the Strength Of The Correlation between two or more sets of random variates. A positive covariance means the variables are positively related, while a negative covariance means the variables are inversely related.
Equation
How to Calculate
1. Subtract the each value of x by the mean (i.e. average) of x.
2. Subtract the each value of y by the mean (i.e. average) of y.
3. Multiply the results of step 1 and step 2.
4. Repeat steps 1 through 3 for each value of x and y.
5. Add the results of step 4.
6. Subtract the number of samples by the value of 1.
7. Divide the results of step 5 by the result of step 6.
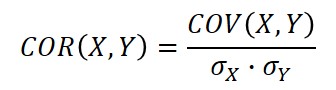
Correlation
Once you determine that two or more variables are correlated, you may want to evaluate the strength of dependence. The correlation function will help you accomplish this.
Definition
A quantity measuring the strength of Interdependence of two variable quantities.
Equation
How to Calculate
1. Calculate the covariance of X and Y.
2. Multiply the standard deviation of x and the standard deviation of y.
3. Divide the result of step 1 by the result calculated in step 2.
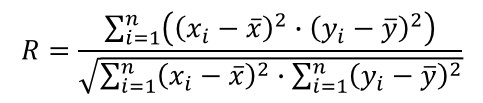
Correlation Coefficient (R)
After performing regression, you may want to determine if two variables are influenced by each other. To find out, use the correlation coefficient to find the strength and direction of their relationship.
Definition
A quantity measuring the strength of linear Interdependence of two variable quantities.
Equation
How to Calculate
1. Subtract the value of x by the mean (i.e. average) of x.
2. Square the result of step 1.
3. Subtract the value of y by the mean (i.e. average) of y.
4. Square the result of step 3.
5. Multiply the result of step 2 by the result of step 4.
6. Repeat steps 1 through 5 for each value of x and y in the sample set.
7. Add all the results calculated in step 6.
8. Subtract the value of x by the mean (i.e. average) of x.
9. Square the result of step 1.
10. Repeat steps 8 and 9 for each value of x in the sample set.
11. Add all the results calculated in step 10.
12. Subtract the value of y by the mean (i.e. average) of y.
13. Square the result of step 1.
14. Repeat steps 12 and 13 for each value of y in the sample set.
15. Add all the results calculated in step 14.
16. Multiply the results of step 10 and step 14.
17. Calculate the Square Root of the result in step 16.
18. Divide the result of step 7 by the result of step 17.
Evaluation Rules
1. The strongest linear relationship is indicated by a correlation coefficient of -1 or 1.
2. The weakest linear relationship is indicated by a correlation coefficient of 0.
3. A positive correlation coefficient means one variable increases as the other variable increases.
4. A negative correlation coefficient means one variable increases as the other variable decreases.
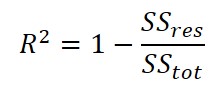
Coefficient of Determination (R2)
Another method commonly used to evaluate regression models is the coefficient of determination. It is a function that evaluates the model’s ‘goodness of fit’ or how well the model fits the data.
After finding an equation that models your measurement function, it is important to determine how well the model fits the data. The coefficient of determination is the most commonly used function to determine goodness of fit.
Definition
The Proportion of Variance in the output variable y that is predictable from the input variable x.
Equation
How to Calculate
1. Calculate the sum of squares of residuals;
a. Subtract of the predicted output variable y by the predicted.
b. Square the result calculated in step 1a.
c. Repeat steps 1a and 1b for each output variable y.
d. Add the results calculated in step 1c.
2. Calculate the total sum of squares;
a. Subtract of the output variable y by the mean
b. Square the result calculated in step 2a.
c. Repeat steps 2a and 2b for each output variable y.
d. Add the results calculated in step 2c.
3. Divide the result calculated in step 1 by the result calculated in step 2.
4. Subtract the result calculated in step 3 from the value of 1.
Evaluation Rules
1. A value of 0 means the dependent variable y cannot be predicted from the independent variable x.
2. A value of 1 means the dependent variable y can be predicted without error from the independent variable x.
3. A value between 0 and 1 indicates the extent the dependent variable is predictable (e.g. 0.90 means 90% of the variance of y is predictable from x),
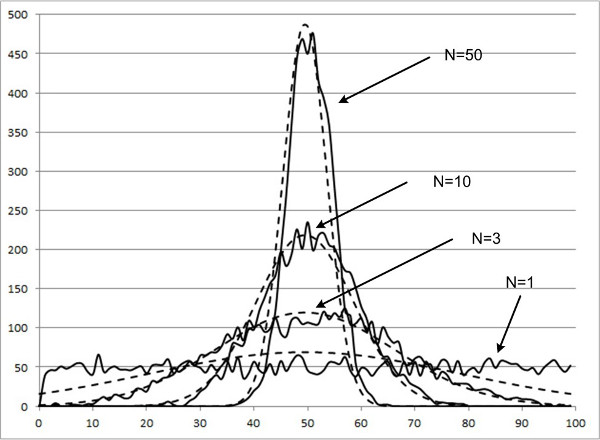
Central Limit Theorem
When estimating uncertainty, you combine many different probability distributions. For this reason, it is important to know about the Central Limit Theorem to understand how your uncertainty estimate approaches a Normal distribution.
Definition
The Distribution of the mean (i.e. average) of a large number of independent, identically distributed variables will be approximately normal, regardless of the underlying distribution.
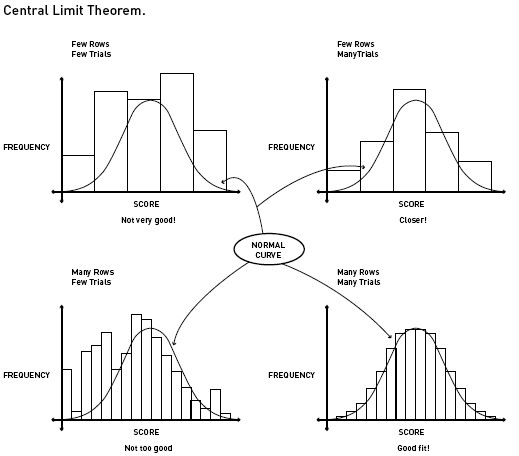
The more samples that you collect, the more your data begins to resemble a normal distribution.
Standard Deviation of the Mean
Sometimes you want to know more about your data; specifically, the uncertainty of your average measurement result or the uncertainty of your calculated uncertainty. The standard deviation of the mean will tell you the variability of your calculated mean.
Definition
An estimate of the Variability between sample means if multiple samples were taken from the same population.
Standard Deviation of the Mean vs Standard Deviation
The standard deviation of the mean estimates the variability between samples whereas the standard deviation measures the variability within a single sample.
Equation
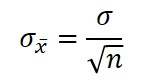
How to Calculate
1. Calculate the standard deviation of a sample set.
2. Count the number of samples taken.
3. Calculate the Square Root of the result from step 2.
4. Divide the results of step 2 by the result from step 1.
Confidence Intervals
When you need to set parameters that ensure a specific percentage of results occur within that region, you want to establish confidence intervals.
Definition
An estimated Range of Values which is likely to include an unknown population parameter, the estimated range being calculated from a given set of sample data.
Equation
Where,
For a known standard deviation: 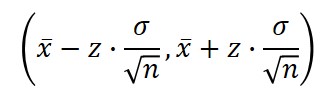
For an unknown standard deviation: 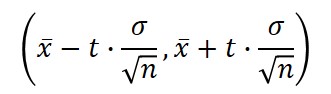
How to Calculate
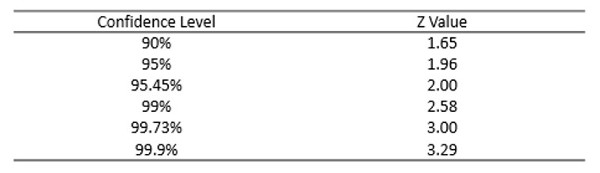
Find Zα/2
1. Choose your desired confidence level (e.g. 95%).
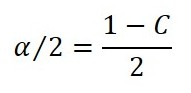
2. Calculate the value of alpha over 2.
a. Divide the result of step 1 by 100.
b. Subtract the value of 1 by the result calculated in step 2a.
c. Divide the result of step 2b by 2 (for two-tailed distributions).
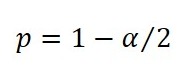
3. Calculate the critical probability (p):
a. Subtract the value of 1 by the result calculated in step 2c.
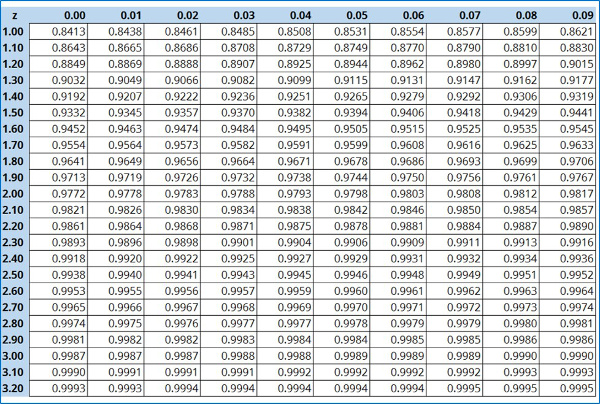
4. Using the result of step 3, refer the Critical Values Z Table for the expansion factor z.
a. Find the result calculated in step 3a in the Critical Values Z Table.
b. Find the value of the intersecting row (left-most column).
c. Find the value of the intersecting column (top row).
d. Add the results of step 4a and 4b.
Critical Values Z Table
Find tα/2
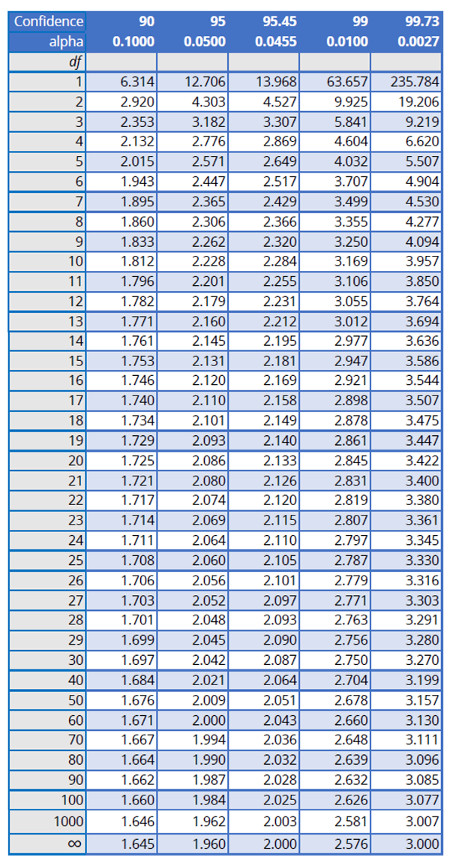
1. Choose your desired confidence level (e.g. 95%).
2. Count the degrees of freedom.
3. Using the result of step 2, refer the Student’s T Table for the expansion factor t.
a. Find the column that corresponds with the chosen confidence level.
b. Find the row that corresponds with the number of degrees of freedom.
c. Find the value where the results of 3a and 3b intersect.
Student’s T Table
Z-Score
Want to determine how many standard deviations a result is from the population average or mean? Evaluate the result by calculating the Z-score of the result.
Definition
A statistical measurement of a score’s relationship (i.e. how many Standard Deviations above or below the population mean) to the mean in a set of scores.
Equation
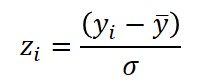
How to Calculate
1. Choose a value from the data set.
2. Subtract the value by the population mean (i.e. average).
3. Divide the result of step 2 by the standard deviation of the sample set.
T-Score
Another method for determining how far a result is from the mean is the T-score. The advantage of using the T-score, rather than the Z-score, is it is typically easier to evaluate and explain the results.
Definition
A Ratio of the departure of an estimated parameter from its notional value and its standard error.
Equation
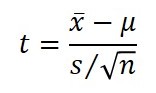
How to Calculate
1. Calculate the sample mean, x.
2. Calculate the population mean, µ.
3. Calculate the sample standard deviation, s.
4. Count the number of independent samples, n.
5. Subtract the sample mean by the population mean.
6. Calculate the Square Root of the number of samples.
7. Divide the sample standard deviation by the result calculated in step 6.
8. Divide the result calculated in step 5 by the result calculated in step 7.
Student’s T Distribution
Use the Student’s T Distribution to establish confidence intervals based the number of degrees of freedom.
Definition
A Probability Distribution that is used to estimate population parameters when the sample size is small and/or when the population variance is unknown.
Equation
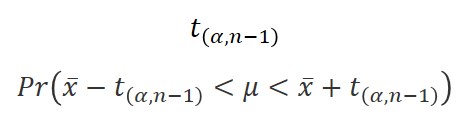
How to Calculate
1. Choose a desired confidence interval, α.
2. Calculate the degrees of freedom, n-1.
3. Refer to the Student’s T table to find your coverage factor;
a. Find the column that matches the desired confidence interval.
b. Find the row that matches the calculated degrees of freedom.
c. Find where the column and row intersect to find the value of t.
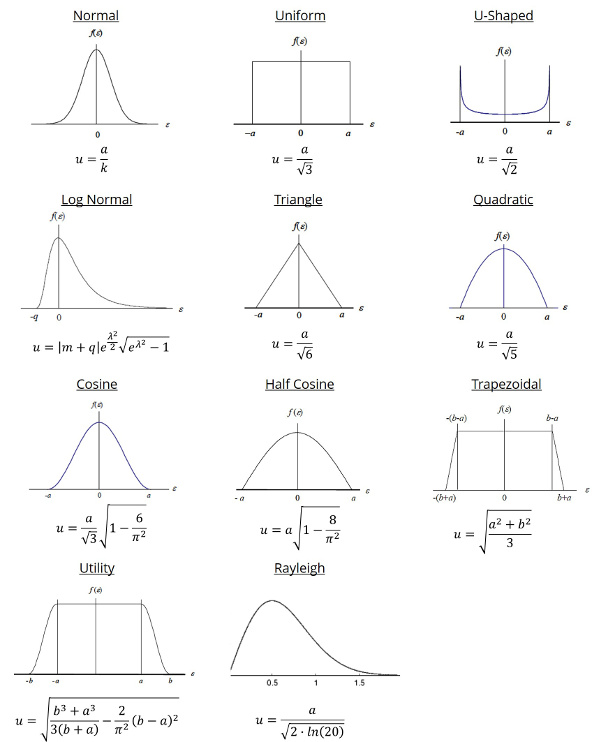
Probability Distributions
Reduce your uncertainty influences to standard deviation equivalents based on how the population data is distributed. Determine which probability distribution best describes your data and use the chart below to find the appropriate divisor.
Conclusion
Statistics is a key component to calculate uncertainty in measurement. Without statistics, you would not be able to estimate uncertainty and evaluate your results.
I hope this introduction to statistics guide will be helpful to you, and a handy reference tool for your uncertainty analysis efforts.
Again, this is only an introduction to statistics for uncertainty analysis. I will release a more comprehensive guide with advanced statistical functions in the future. In the meantime, if you feel that I have left something out, please email me to recommend additional functions.
Now, leave a comment below telling me which statistical function you would like to learn more about.


17 Comments