INTRODUCTION
Performing a repeatability test is an essential part of estimating uncertainty in measurement. It is the most common experiment performed to collect Type A Uncertainty data.
Additionally, most accreditation bodies require that you include repeatability data in your uncertainty budgets. However, many people have trouble with performing a repeatability test. They do not know how to conduct the experiment, collect the data, or analyze the results.
In this guide, you are going to learn everything that you need to know about repeatability testing;
- What is a repeatability test,
- How to perform a repeatability test,
- How to calculate repeatability, and
- How to add repeatability to your uncertainty budgets.
Plus, I have created some great tools to help you perform a repeatability test and analyze the results next time you need to estimate measurement uncertainty.
BACKGROUND
Every day, I work with clients who need my help to estimate uncertainty in measurement. During the process, I typically ask clients to perform repeatability and reproducibility testing.
However, many of my clients do not know how to conduct a repeatability test. So, they ask for procedures, checklists, and consultation.
After years of continually helping clients perform a repeatability test, I noticed that I had not written a formal guide to help these clients; nor automate the process.
Therefore, I decided to create a guide dedicated to repeatability testing in order to answer all of the questions that I have been asked.
In this guide you will learn;
- What is Type A Uncertainty
- What is A Repeatability Test
- How to Perform a Repeatability Test
- How Many Samples You Should Collect
- How to Collect Repeated Samples
- How to Calculate Repeatability (Single Test)
- How to Calculate Repeatability (Multiple Tests)
- How to Add Repeatability to Your Uncertainty Budgets
- Standard Deviation vs Standard Deviation of the Mean
Click here to download the repeatability test cheatsheet & calculator for free!
WHAT IS TYPE A UNCERTAINTY
Type A Uncertainty is a component of uncertainty where data is collected from a series of observations and evaluated using statistical methods associated with the analysis of variance (ANOVA).
Commonly referred to as Type A Data, Type A Uncertainty is typically associated with the results of Repeatability and Reproducibility Testing. However, it can also be associated with stability testing.
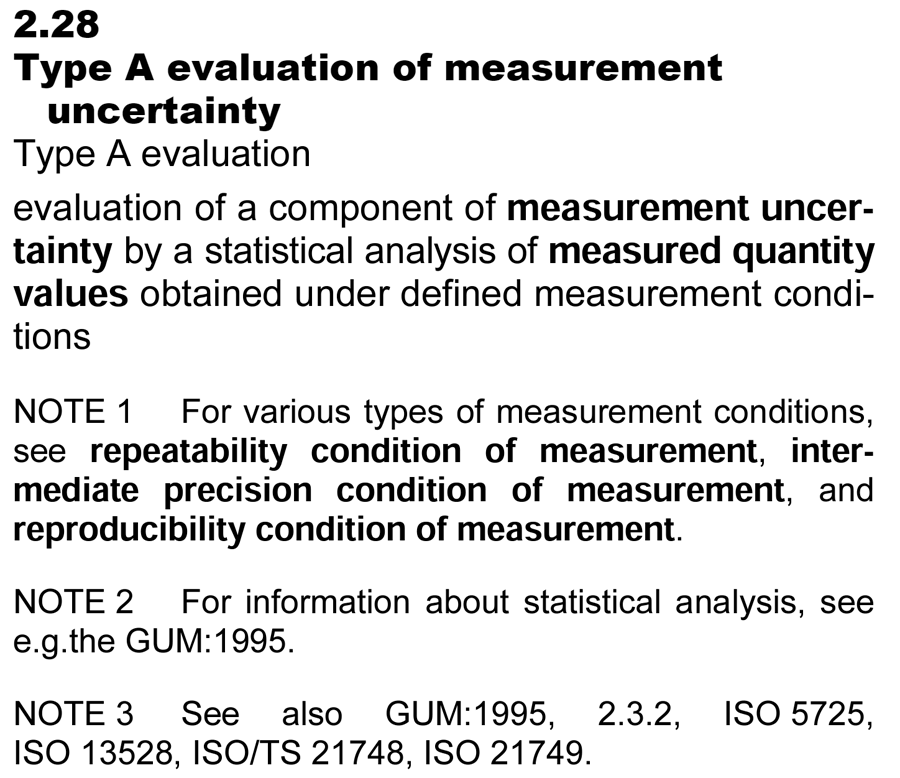
According to the Vocabulary in International Metrology (VIM), Type A Evaluation of measurement uncertainty is a component of measurement uncertainty evaluated by a statistical analysis of measured quantity values that were obtained under defined measurement conditions.
Look at the image below to see the definition from the VIM.
WHAT IS A REPEATABILITY TEST
A repeatability test is an experiment performed to evaluate how repeatable your results are under a set of similar conditions.
When performing a repeatability test, you want to collect data using the;
- Same method,
- Same operator,
- Same equipment,
- Same environmental conditions,
- Same location, and
- Same item or unit under test.
Essentially, you want to collect repeatable results over a short period of time without changing anything (if possible).
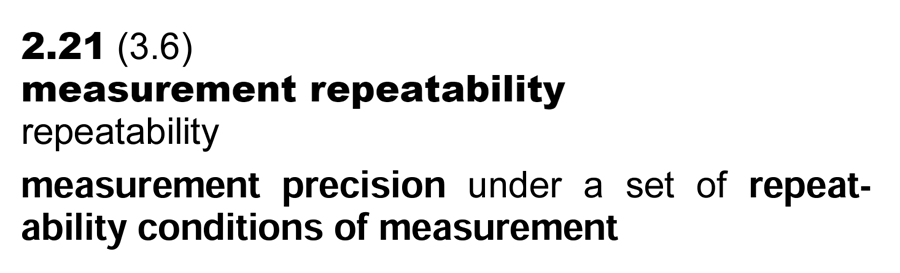
According to the Vocabulary in International Metrology (VIM), measurement repeatability is measurement precision under a set of repeatable conditions of measurement.
The image below is an excerpt from the VIM for the definition of Measurement Repeatability.
Now, to understand the definition of measurement repeatability you must also define repeatability condition of measurement.
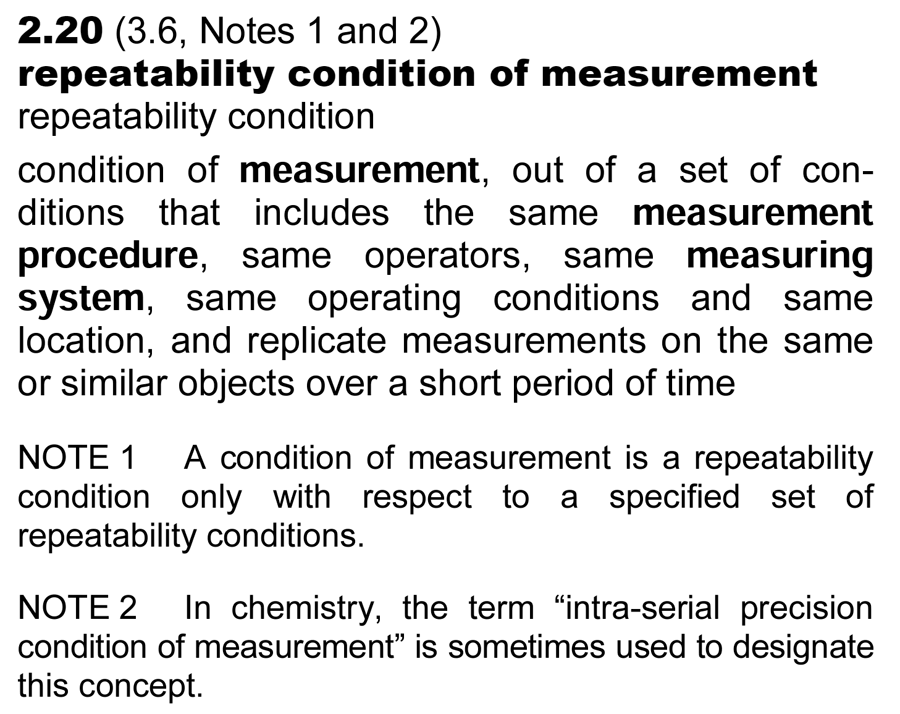
According to the VIM, a Repeatability Condition of Measurement is a condition of measurement, out of a set of conditions that includes the same measurement procedure, same operators, same measuring system, same operating conditions, same location, and same replicate measurement on the same or similar objects over a short period of time.
The image below is an excerpt from the VIM for the definition of Repeatability Condition of Measurement.
Therefore, you need define your measurement conditions and collect repeatable results over a short period time so you can evaluate the precision of your process.
In the next section, I will cover how to perform a repeatability test step-by-step.
HOW TO PERFORM A REPEATABILITY TEST
To calculate repeatability, you need to have a procedure.
Similar to every test or measurement performed in your laboratory, you must have a method or procedure to guide you through the process and ensure consistency in your results.
In this section, you will learn to perform a repeatability test step by step. Follow the instructions below to add repeatability test data to your uncertainty budgets.
Here is a list of the steps in this process;
- Select the measurement function to test,
- Select the measurement range,
- Select the test-point(s),
- Select the method,
- Select the equipment,
- Select the operator,
- Perform the test,
- Collect the number n of repeated samples,
- Analyze your results,
- Save a record of your results (recommended),
- Add the result to your uncertainty budget.
1. Select the Measurement Function
Before you begin performing a repeatability test, it is a good idea to determine what you are going to test.
Start by selecting the measurement function that will be tested.
The measurement function will be the category that best describes your measurement or test result, such as;
- DC Voltage Generate/Measure
- Length
- Pressure Generate/Measure
- Torque Generate/Measure
- Temperature Source/Measure
If you are having trouble, take a look at your scope of accreditation (or another laboratory’s scope of accreditation) and pick the measurement function that you would like to test.
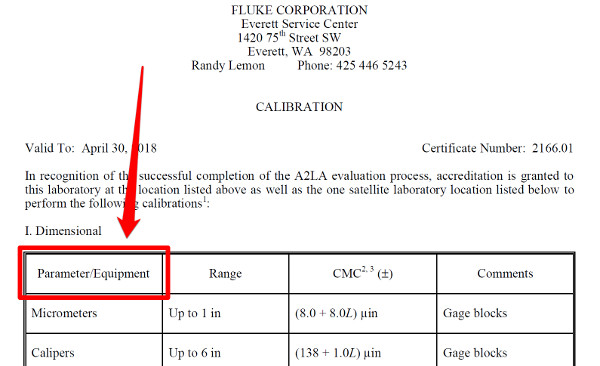
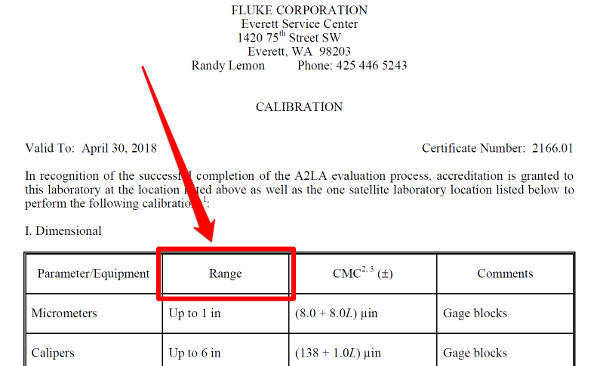
2. Select the Measurement Range
After selecting the measurement function, pick a measurement range to test. This should consist of a chosen starting measurement value and an ending measurement value; typically low to high.
I recommend that you pick a measurement range listed in your scope of accreditation or in the equipment manufacturer’s specifications.
3. Select the Test Points
Now that you have specified a measurement range, it is time to select the test-points for your repeatability test.
If you assume that your measurement function is linear, you will need to select two test-points along the measurement range. Typically, it should be a low value and a high value.
Some common practices are to select test points that are at 10% and 90% of the measurement range or at 20% and 100% of the measurement range. For best results, I recommend that you select two calibration points along the measurement range (if available).
If you assume that your measurement function is non-linear, you may want to select three of more test points to evaluate. This will help you prevent errors due to the curvature of the measurement function.
Should you decide to perform a repeatability test at three of more test points, try to select evenly spaced test points to prevent modeling errors in your CMC Uncertainty equation..
4. Select the Method
The next step to performing a repeatability test is to select the measurement method or procedure. You will want to select a method or procedure that best represents the how the measurement process is performed.
A good place to start is to use a test method or calibration procedure that best represents your measurement process. This will help you make sure that you are evaluating a measurement process that you would normally perform in your laboratory.
If you do not have a procedure, try writing one for your process. Even if the procedure minimally covers the steps of the process, it is still better than nothing. Additionally, it will help you get consistent results.
5. Select the Equipment
Following the chosen method, select the equipment recommended to perform your measurement process. Make sure that your equipment is calibrated and functioning properly before use.
For best results, select the most accurate equipment available to you. The equipment you choose will affect the results. So, select your best equipment.
6. Select the Operator
Select an operator to perform the repeatability test. Pick an operator that is qualified and experienced at performing the test or measurement.
Typically, your most experienced or qualified operators will yield the best results.
Your goal should be to achieve consistent repeatable results. Therefore, choose an operator that you will help you achieve it.
7. Perform the Repeatability Test
Now that you have established all of your conditions, it is time to perform a repeatability test for the measurement function, range, and test-points that you selected using the method, equipment, and operator that you selected.
Perform steps eight through eleven to conduct a repeatability test.
8. Collect ‘n’ Number of Samples and Record Your Results
When performing a repeatability test, collect a defined number of repeated samples. Typically, it is recommended that you collect at least 20 to 30 samples to obtain statistically significant results.
However, collecting 20 to 30 samples is not always practical for every test or measurement. Instead, collect the number of samples that is most appropriate for your situation and measurement system.
If you can only collect 5 samples because the test or measurement process is time-consuming or labor-intensive, then only collect 5 samples. If you can collect 100 samples because your test or measurement process is quick and automated, then collect 100 samples.
Only collect the number of samples that is most appropriate for your situation.
9. Analyze Your Results
After collecting samples, you will need to analyze your data using the analysis of variance (ANOVA). Calculate the standard deviation, standard deviation of the mean, and the degrees of freedom.
If you are analyzing a single set of data, you will use the calculated standard deviation of the mean and degrees of freedom in your uncertainty budget.
If you are analyzing multiple sets of data, you will need to use the method of pooled variance to calculate the pooled standard deviation of the mean and degrees of freedom for your uncertainty budget.
10. Save a Record of Your Results (Recommended)
Anytime that you collect data, it is a good idea to save a record of your results. It will come in handy if you need to go back and review your results or compare them with other repeatability test data.
I always recommend that you keep files for your repeatability test data. However, you do not have to keep records. Instead, you can just collect Type A data each time you update your uncertainty budgets. The choice is yours.
11. Add the Results to Your Uncertainty Budget
Finally, add your repeatability test results to your uncertainty budgets.
Create a line item for repeatability and include the standard deviation and the degrees of freedom in your budget.
Characterize your repeatability results with a Normal distribution where ‘k’ equals one (i.e. k=1).
For step-by-step instructions, read the section below: How to Add Repeatability to Your Uncertainty Budget.
HOW MANY SAMPLES SHOULD YOU COLLECT
A common question people ask when performing a repeatability test is, “How many samples should I collect?”
The answer is, “As many as you practically can.”
Recommended Number of Samples
As a general rule of thumb, it is typically recommended to collect 20 to 30 samples to be statistically sound. However, this rule is not applicable to every scenario.
If you are using automation and have the capability to collect 100 or more samples over a short period of time, then collect 100 or more samples. It is practical for your test or measurement process.
If you are performing a test or measurement that is difficult, costly, or time-consuming, it may be hard to collect 20 to 30 samples. Therefore, you should collect fewer samples. In this situation, it may be more practical to only collect three to five samples.
Make sure to select the number of samples that is appropriate for your measurement process.
Do not over think it. Start with 20 samples and adjust the number of samples collected based on your situation.
Can’t Collect 20 Samples
A tactic that I like use is start with 20 samples. If 20 samples is not practical, then I half the number of samples (i.e. divide n by 2).
Next, determine if 10 samples is practical. If not, then I half the number of samples again. If 5 samples is still not practical, then I reduce the number of samples to 3.
Need More Than 20 Samples
Sometimes, you need to collect more than 20 samples. When this happens, I step up the number of samples in a sequence of 1, 2, or 5.
For example, if I need more than 20 samples, then I increase the number of samples to 50 and evaluate whether this is practical or necessary. If more is needed, then I increase the number of samples again to 100 and evaluate whether it is practical or necessary. If more are needed, then increase the number of samples again. If not, then I stay at the current number of samples or decrease the number back to the previous number.
There is no limit here. Increase the number of samples as necessary for your application and adjust as needed.
Optimizing the Number of Samples
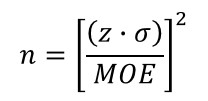
If you would like to manipulate your results to achieve a desired margin of error (i.e. standard deviation), use the formula below;
How to Calculate
Follow the instructions below to calculate the optimal number of samples:
- Choose your desired confidence level (z).
- Choose your desired margin of error (MOE).
- Multiply the result of step 1 by the value by standard deviation of the sample set.
- Divide the result by the margin of error selected in step 2.
- Square the result calculated in step 4.
HOW TO COLLECT REPEATED SAMPLES
When performing a repeatability test, some people get confused on how to collect repeated samples. They believe (or have been told) that they must;
- Set-up a test,
- Collect a result,
- Break-down the setup, and
- Repeat the process ‘n’ number of times.
This is not true.
Conducting a repeatability test following the process above would be rigorous and time-consuming. Additionally, this would be more like a reproducibility test than a repeatability test.
Instead, think about how you could collect the data easier and faster if you were to follow this process;
- Set-up a test,
- Collect a result,
- Repeat ‘n’ number of times, and
- Break-down the setup.
If you follow this process, you would be able to complete a repeatability test much faster. So, to make repeatability testing less rigorous, make sure to collect repeated samples back-to-back over a short period of time.
This is consistent with the VIM definition, “Repeatability Condition of Measurement.”
If your measurement equipment continuously samples and refreshes the display with new results, then collect ‘n’ number of displayed results back-to-back over a short period of time.
Should your measurement equipment require manual sampling, repeat the process again and again until you collect your desired number of samples.
If you are testing samples, prepare your samples from the same source or lot using the same method and equipment (so they are as homogeneous as possible). Also, prepare enough samples to perform repeatability testing. Then, setup your equipment and run the samples back-to-back.
Do not break down your test set-up after each sample and repeat. That process is actually form of reproducibility testing, not repeatability testing.
HOW TO CALCULATE REPEATABILITY (SINGLE TEST)
Analyzing the results of a single repeatability test is simple. Just calculate the:
- standard deviation, and
- standard deviation of the mean.
In this section, you will learn how to calculate repeatability by analyzing the results of a single set of data. This will be done using analysis of variance (i.e. ANOVA) by performing the evaluations listed below.
- Calculate the Standard Deviation,
- Count the number of readings in results (typically 1), and
- Calculate the standard deviation of the mean.
In the following sections, I will show you how to perform each of these calculations in Microsoft Excel.
1. Calculate the Standard Deviation using Excel
First, you want to calculate the standard deviation of the repeated results.
Look at the image below to see how to calculate standard deviation in Microsoft Excel. Plus, I have included step-by-step instructions to help you perform the evaluation.

How to Calculate
Follow the instructions below to calculate the standard deviation:
- Select a cell to calculate the standard deviation.
- Type “=STDEV(“ in the cell.
- Select the cells containing your results.
- Type “)“ and press the “Enter” key.
Here is the formula that you can use in Microsoft Excel. Replace “repeated readings” with the cells that contain your repeated readings.
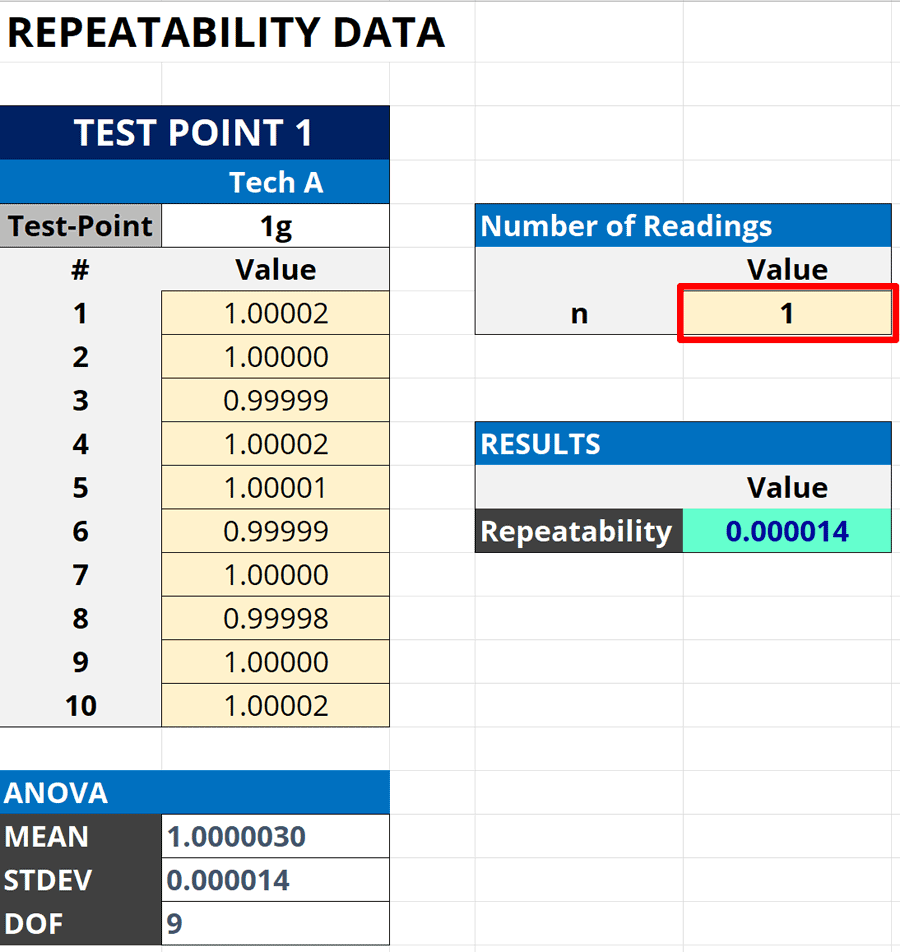
2. Count the Number of Samples in Test/Calibration Results
Next, find the number of samples associated with your test or calibration results.
Finding the Number of Samples (n)
Review your method or procedure to determine how many repeated samples or readings are required to achieve the results reported in test or calibration certificates.
Single Measurements
If your test or calibration results are based on a single measurement, then the number of samples is one (e.g. 1).
Most test and calibration results are based on single-measurements.
Average of Repeated Measurements
If your test or calibration results are the calculated average of repeated measurements, then the number of samples (n) is equal to the number of observations made to calculate the average.
Common Mistake
Please read. This is important!
People often confuse the number of observations with the number of samples collected during repeatability testing. Do not make this mistake.
The number of samples is based on the number of repeated readings required to calculate an average test or calibration result (reported in certificates).
If your test or calibration process requires you to perform repeated readings, then the number of samples will match the number of repeated readings required by your test or calibration method.
For more information, refer to the JCGM 100:2008, sections 4.2.2, 4.2.3, and 4.2.4.
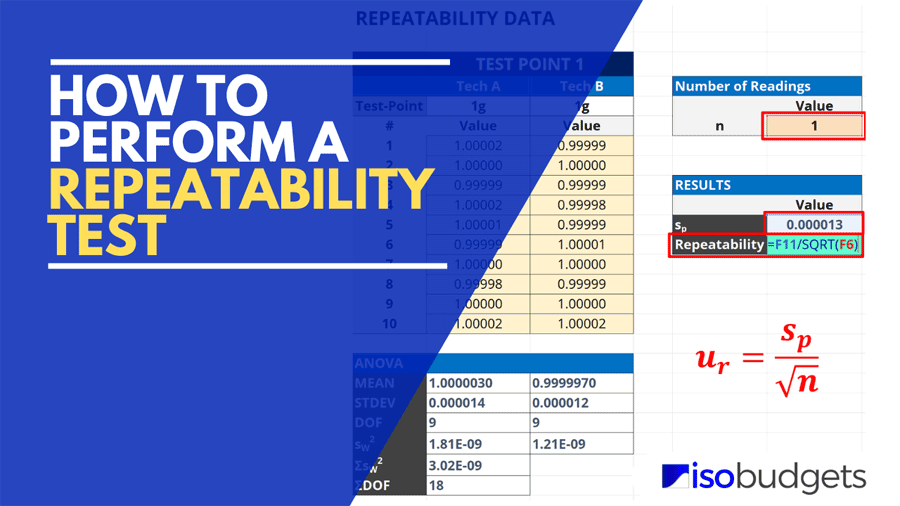
3. Calculate the Standard Deviation of the Mean
Finally, calculate the standard deviation of the mean.
To calculate it, take the standard deviation calculated in Step 1 and divide it by the square root of the number of samples (or observations) in Step 2.
The result will be your repeatability uncertainty.
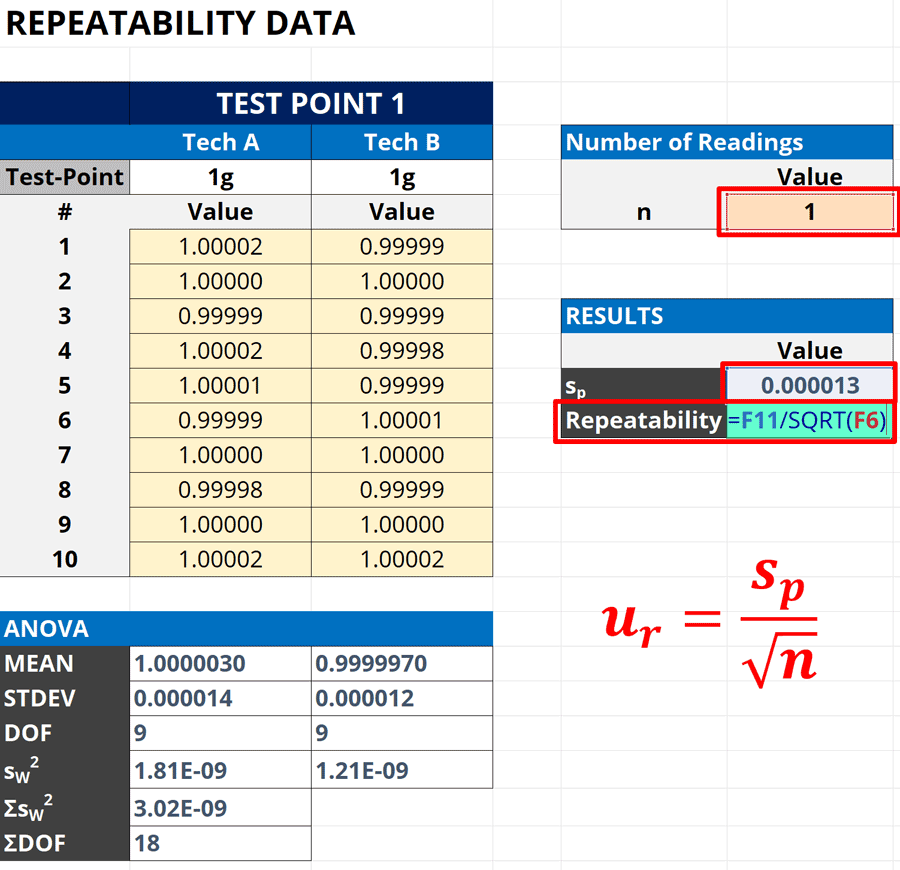
Look at the image below to see how to calculate standard deviation of the mean in Microsoft Excel.
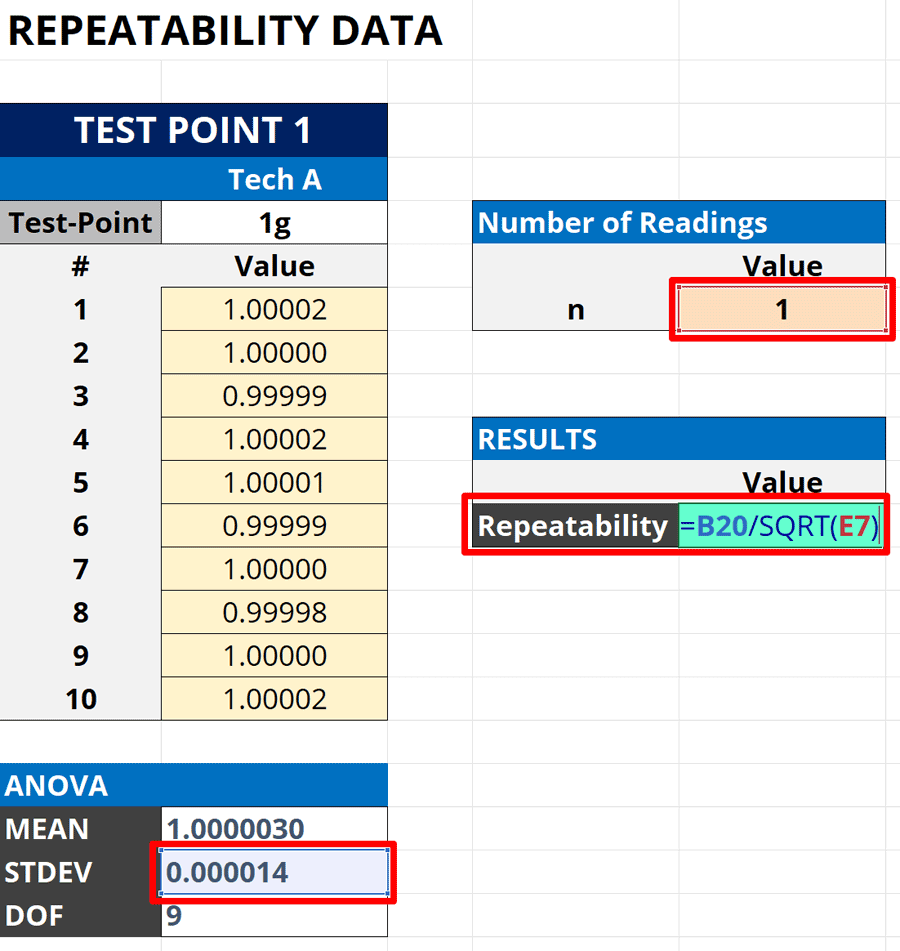
How to Calculate
Follow the instructions below to calculate the standard deviation of the mean.
- Select a cell to calculate the standard deviation of the mean.
- Type “=“ in the cell.
- Select the cell that contains the standard deviation.
- Type “/SQRT(“ and press the “Enter” key.
- Select the cell that contains the number of samples.
- Type “)“ and press the “Enter” key.
Below is the formula you can use in Excel. Replace “standard deviation” and “number of samples” with the appropriate cells or values.
The calculated standard deviation of the mean is your repeatability uncertainty. Add it to your uncertainty budget.
HOW TO CALCULATE REPEATABILITY (MULTIPLE TESTS)
Analyzing the results of a several repeatability tests is more complex. You cannot average standard deviations, so you must pool them together using the method of pooled variance.
Here is a list of the steps you must take to calculate repeatability for multiple data sets.
- Calculate the Standard Deviation,
- Calculate the Degrees of Freedom,
- Calculate the Pooled Standard Deviation,
- Count the number of readings in results (typically 1), and
- Calculate the standard deviation of the mean.
In the following sections, I will show you how to perform each of these calculations in Microsoft Excel.
1. Calculate the Standard Deviation using Excel
First, you want to calculate the standard deviation of the repeated results.
Look at the image below to see how to calculate standard deviation in Microsoft Excel. Plus, I have included step-by-step instructions to help you perform the evaluation.
How to Calculate
Follow the instructions below to calculate the standard deviation:
- Select a cell to calculate the standard deviation.
- Type “=STDEV(“ in the cell.
- Select the cells containing your results.
- Type “)“ and press the “Enter” key.
Here is the formula that you can use in Microsoft Excel. Replace “repeated readings” with the cells that contain your repeated readings.
2. Calculate the Degrees of Freedom using Excel
Next, calculate the degrees of freedom for each data set.
This step is necessary to calculate the pooled standard deviation, so do not skip it.
The image below shows how to calculate degrees of freedom in Excel. Plus, I have included step-by-step instructions to help you perform the evaluation.
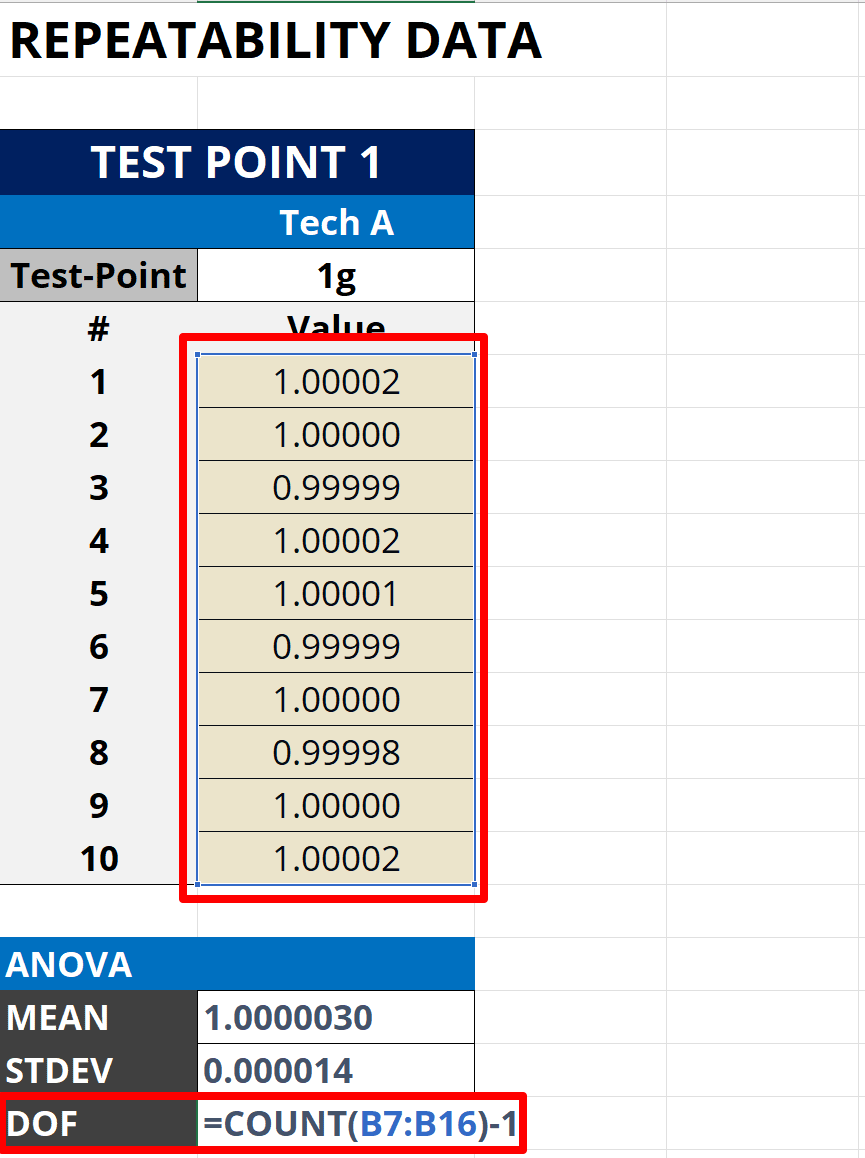
How to Calculate
Follow the instructions below to calculate the degrees of freedom:
- Select a cell to calculate the degrees of freedom.
- Type “=COUNT(“ in the cell.
- Select the cells containing your results.
- Type “)-1“ and press the “Enter” key.
Here is the formula that you can use in Microsoft Excel. Replace “repeated readings” with the cells that contain your repeated readings.
3. Calculate the Pooled Standard Deviation Using Excel
Now, you need to calculate the pooled standard deviation. The reason you pool standard deviations is because it is inappropriate to calculate their average. Many people make this mistake.
To calculate the pooled standard deviation, you need to perform the following three steps:
- Calculate the weighted variance,
- Calculate the total weighted variance,
- Calculate the total degrees of freedom, and
- Calculate the pooled standard deviation.
In the sections below, I am going to explain how to perform each one of these steps in more detail.
3a. Calculate the Weighted Variance
To calculate the pooled standard deviation, you first need to calculate the weighted variance.
This method comes from the NIST SEMATECH. To perform the calculation, square the standard deviation (to convert it to a variance) and multiply the results by the degrees of freedom.
The degrees of freedom are used as the weighting factor. Therefore, standard deviations with more degrees of freedom will have more influence on the calculated pooled standard deviation.

How to Calculate
Follow the instructions below to calculate the weighted variance.
- Select a cell to calculate the weighted variance (i.e. SS).
- Type “=CELL1*CELL2^2“ in the cell and press the “Enter” key.
- Copy and Paste function into other cells.
Here is the formula that you can use in Microsoft Excel. Replace “degrees of freedom” and “standard deviation” with the cells that contain the information.
3b. Calculate the Total Weighted Variance
Next, calculate the total weighted variance. Simply, add together all the weighted variances calculated in the previous step.
Look at the image below to see how total weighted variance is calculated in Excel.
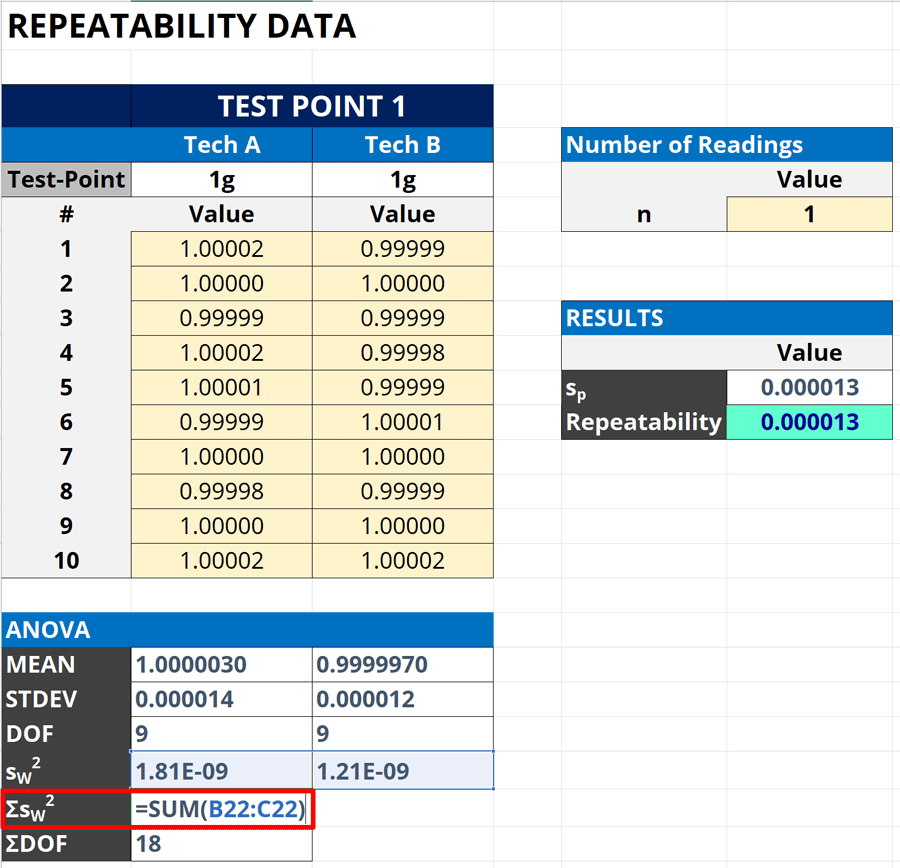
How to Calculate
Follow the instructions below to calculate the total weighted variance:
- Select a cell to calculate the total weighted variance.
- Type “=SUM( “ in the cell.
- Select the cells containing your results.
- Type “)“ and press the “Enter” key.
Here is the formula that you can use in Microsoft Excel. Replace “weighted variances” with the cells that contain the information.
3c. Calculate the Total Degrees of Freedom
Then, calculate the total degrees of freedom. Simply, add together all the degrees of freedom previously calculated.
Look at the image below to see how total degrees of freedom is calculated in Excel.

How to Calculate
Follow the instructions below to calculate the total degrees of freedom:
- Select a cell to calculate the total degrees of freedom.
- Type “=SUM( “ in the cell.
- Select the cells containing your results.
- Type “)“ and press the “Enter” key.
Here is the formula that you can use in Microsoft Excel. Replace “degrees of freedom” with the cells that contain the information.
3d. Calculate the Pooled Standard Deviation
Finally, calculate the pooled standard deviation.
Look at the image below to see how the pooled standard deviation is calculated in Excel.
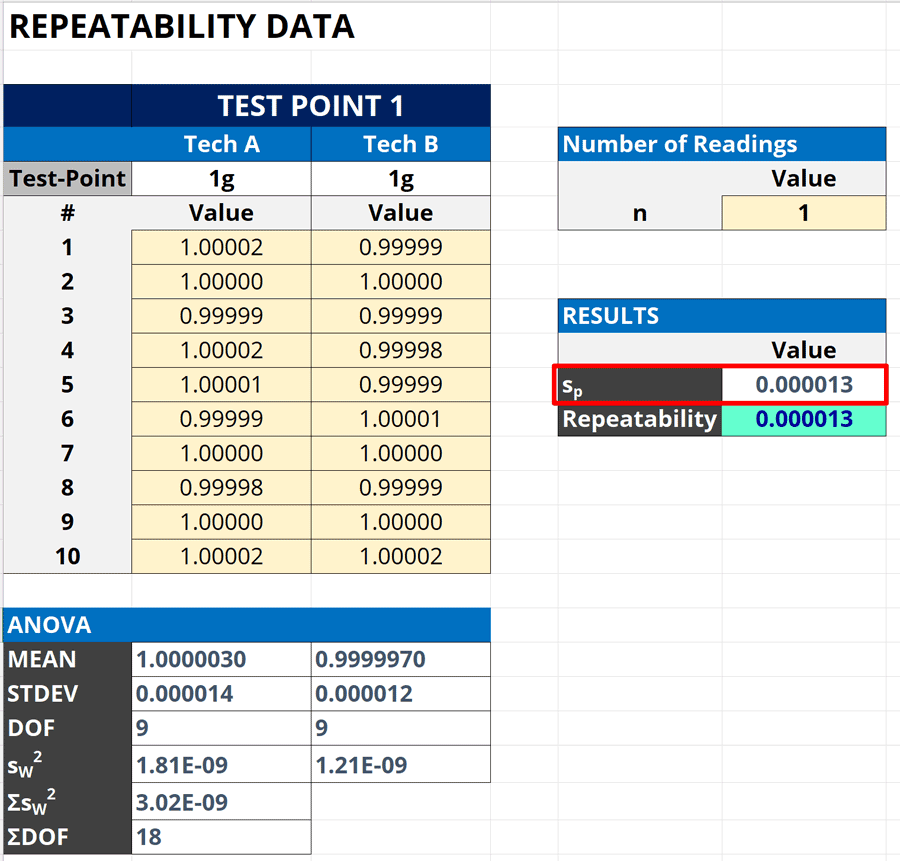
How to Calculate
Follow the instructions below to calculate the pooled standard deviation:
- Select a cell to calculate the pooled standard deviation.
- Type “=SQRT( “ in the cell.
- Select the cell containing the total weighted variance (i.e. ΣsW2).
- Type “/ “ for the divide function.
- Select the cell containing the total degrees of freedom (i.e. ΣDOF).
- Type “)“ and press the “Enter” key.
Here is the formula that you can use in Microsoft Excel. Replace “total weighted variance” and “total degrees of freedom” with the cells that contain the information.
4. Count the Number of Samples in Test/Calibration Results
Next, find the number of samples associated with your test or calibration results.
Finding the Number of Samples (n)
Review your method or procedure to determine how many repeated samples or readings are required to achieve the results reported in test or calibration certificates.
Single Measurements
If your test or calibration results are based on a single measurement, then the number of samples is one (e.g. 1).
Most test and calibration results are based on single-measurements.
Average of Repeated Measurements
If your test or calibration results are the calculated average of repeated measurements, then the number of samples (n) is equal to the number of observations made to calculate the average.
Common Mistake
Please read. This is important!
People often confuse the number of observations with the number of samples collected during repeatability testing. Do not make this mistake.
The number of samples is based on the number of repeated readings required to calculate an average test or calibration result (reported in certificates).
If your test or calibration process requires you to perform repeated readings, then the number of samples will match the number of repeated readings required by your test or calibration method.
For more information, refer to the JCGM 100:2008, sections 4.2.2, 4.2.3, and 4.2.4.
5. Calculate the Standard Deviation of the Mean
Finally, calculate the standard deviation of the mean.
To calculate it, take the standard deviation calculated in Step 1 and divide it by the square root of the number of samples (or observations) in Step 2.
The result will be your repeatability.
Look at the image below to see how to calculate standard deviation of the mean in Microsoft Excel.
How to Calculate
Follow the instructions below to calculate the standard deviation of the mean.
- Select a cell to calculate the standard deviation of the mean.
- Type “=“ in the cell.
- Select the cell that contains the standard deviation.
- Type “/SQRT(“ and press the “Enter” key.
- Select the cell that contains the number of samples.
- Type “)“ and press the “Enter” key.
Below is the formula you can use in Excel. Replace “standard deviation” and “number of samples” with the appropriate cells or values.
The calculated standard deviation of the mean is your repeatability uncertainty.
Add it to your uncertainty budget.
HOW TO ADD REPEATABILITY TO YOUR UNCERTAINTY BUDGET
After performing a repeatability test and analyzing your data, you will want to add the results to your uncertainty budget.
To add repeatability to your uncertainty budget, just follow the step-by-step instructions listed below.
- Add a line item to your uncertainty budget for repeatability,
- Enter the sensitivity coefficient for repeatability (Optional),
- Enter the uncertainty value to the uncertainty budget,
- Enter the unit of measure,
- Enter the Uncertainty Type,
- Select the “Normal“ probability distribution,
- Select the divisor where k=1, and
- Enter the degrees of freedom (Optional).
These instructions should work for any ISOBudgets uncertainty budget calculators and most uncertainty budget calculators offered by other organizations.
If you don’t have an uncertainty budget calculator, you can buy one here.
Keep reading the sections below to learn more about each step of the process.
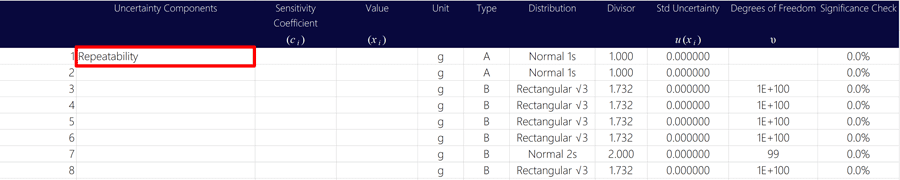
1. Add a line item to your uncertainty budget for repeatability,
Typically, repeatability is the first uncertainty contributor listed in an uncertainty budget.
Find the section in your uncertainty calculator where you list your sources of uncertainty and enter “Repeatability.”
Look at the image below to see how to add the measurement repeatability contributor to your uncertainty budget.
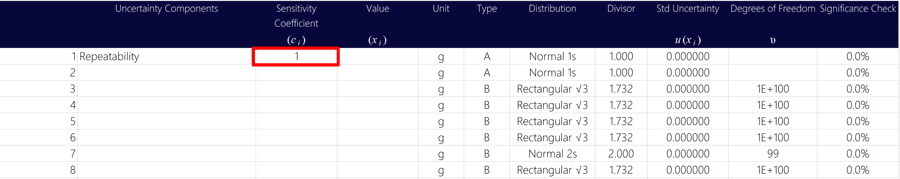
2. Enter your sensitivity coefficient for repeatability (typically “1”),
Next, add your sensitivity coefficient if this option is available in your uncertainty calculator.
It is not common for repeatability to require a sensitivity coefficient other than one (i.e. 1) unless your results are in a different unit of measurement and need to be converted.
Therefore, enter the value of one (i.e. 1) for your sensitivity coefficient.
If sensitivity coefficients are not included in your uncertainty calculator, then you can skip this step.
Look at the image below to see how to add the sensitivity coefficient to your uncertainty budget.
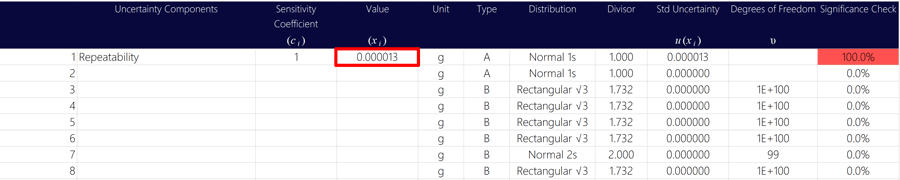
3. Enter your uncertainty value (i.e. standard deviation) to the uncertainty budget,
Now, enter the value of your repeatability uncertainty into your uncertainty calculator.
Look at the image below to see how to add the repeatability uncertainty value to your uncertainty budget.
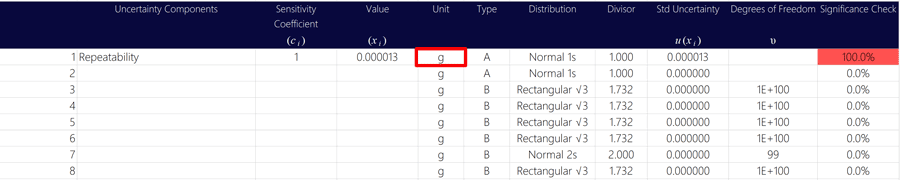
4. Enter the unit of measure,
Make sure to enter the unit of measurement into your uncertainty calculator. This is important to ensure that uncertainty contributors are appropriately evaluated.
Look at the image below to see how to add unit of measurement to your uncertainty budget.
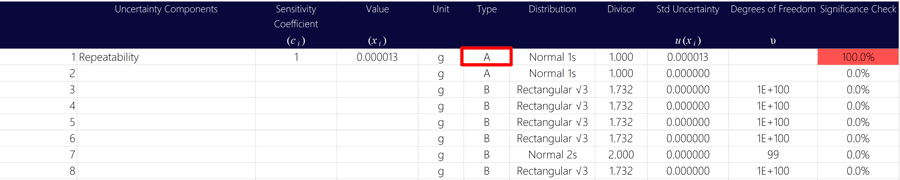
5. Enter the Uncertainty Type (typically “A”),
Next, characterize your uncertainty by selecting the uncertainty type.
Typically, repeatability uncertainty is characterized as a Type A uncertainty. However, it can be characterized as a Type B uncertainty if your repeatability results are not recent.
Look at the image below to see how Type A uncertainty should look in your uncertainty budget.
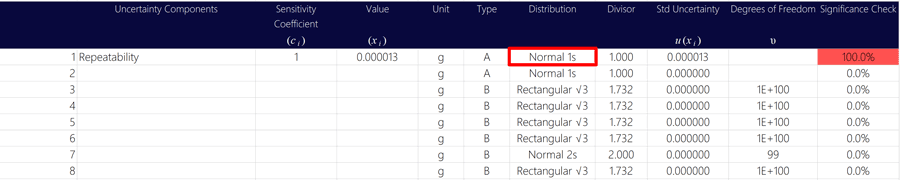
6. Select the “Normal“ probability distribution,
After entering the uncertainty type, select the probability distribution.
Repeatability is characterized with a Normal distribution where k=1 because it’s value is based on a standard deviation which has a confidence level of 68.27%.
Look at the image below to see how the probability distribution should look in your uncertainty budget. Some examples may include:
- Normal (k=1),
- Normal (68%), or
- Normal (1s).
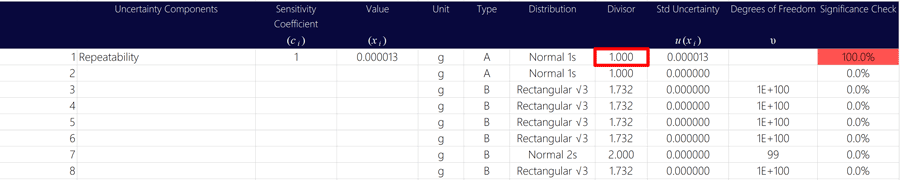
7. Select the divisor where k=1,
As explained above, the uncertainty due to repeatability is based on a calculation of a standard deviation.
Look at the image below to see how the divisor should look in your uncertainty budget.
Use a divisor of one (i.e. 1) in your uncertainty budget.
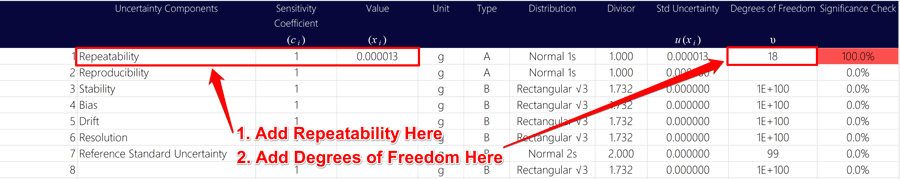
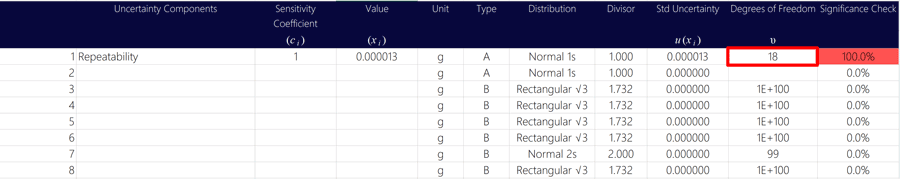
8. Enter your degrees of freedom.
Finally, enter the degrees of freedom associated with the uncertainty due to repeatability if your uncertainty calculator allows it.
Look at the image below to see how to add degrees of freedom to your uncertainty budget.
If degrees of freedom is not included in your uncertainty calculator, then you can skip this step.
STANDARD DEVIATION VS STANDARD DEVIATION OF THE MEAN
When evaluating uncertainty due to repeatability, you have two options:
- Calculate the experimental standard deviation, or
- Calculate the experimental standard deviation of the mean.
Standard Deviation
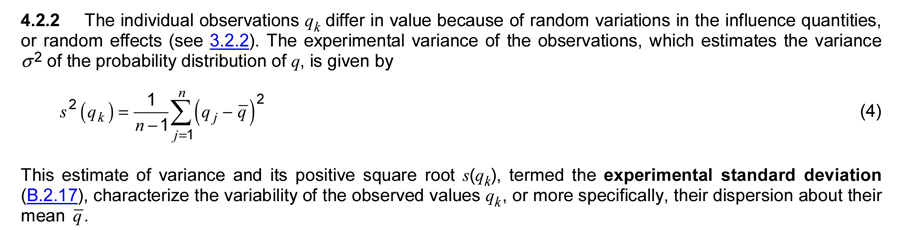
According to the JCGM 100:2008, section 4.2.2 the standard deviation of your repeated samples estimates:
- The variance of the probability distribution, and
- The variability (i.e. dispersion) of observed values about the mean.
Standard Deviation of the Mean
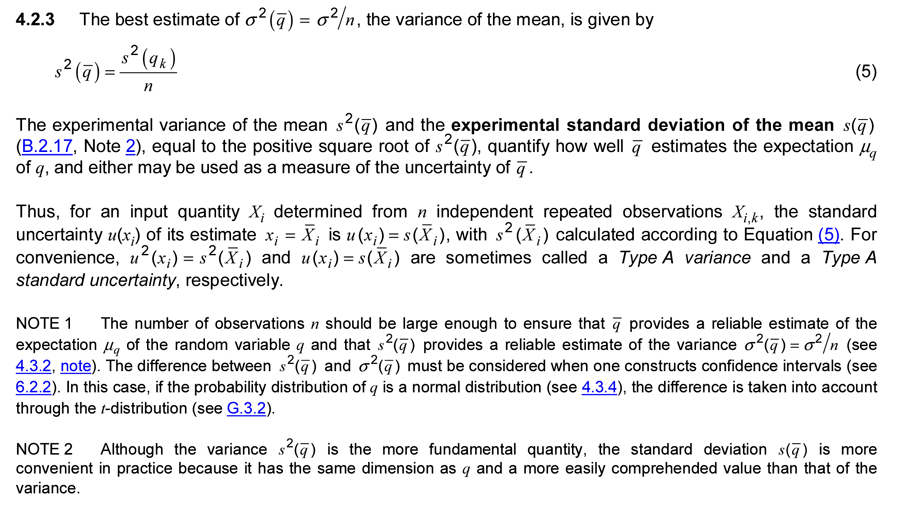
According to the JCGM 100:2008, section 4.2.3 the standard deviation of the mean estimates:
- The variance of the mean (i.e. average) value, and
- The uncertainty of the mean.
What Method to Evaluate Repeatability
So, what should you do? Evaluate repeatability with:
- Standard deviation or
- Standard deviation of the mean?
This is a debatable topic with many opinions.
However, here is my recommendation:
- Single Measurements: If your test or calibration results are based on single measurements, then use the standard deviation.
- Repeated Measurements: If your test or calibration results are based on the average (i.e. mean) of several repeated measurements, then use the standard deviation of the mean.
Take notice that the standard deviation of the mean can still be used on single measurements. However, dividing the standard deviation by the square-root of one will yield the same result as the standard deviation.
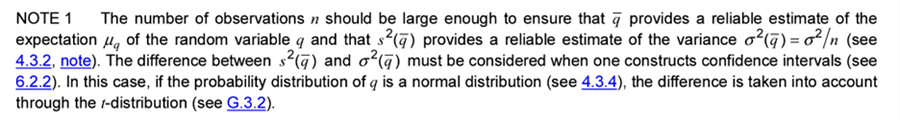
If you evaluate the standard deviation of the mean, you should be aware of the note in the JCGM 100:2008, Section 4.2.3.
The note recommends that your average or mean value should have a large enough number of observations to get a reliable estimate of the mean and variance.
Look at the image below to see the note in section 4.2.3 of the JCGM 100:2008.
REPEATABILITY TEST CHECKLIST & CALCULATOR
Are you ready to perform a repeatability test?
If so, get the repeatability test checklist and calculator. The checklist will give a summary of all the instructions provided in this guide, and the calculator will help you analyze your results so you can calculate repeatability faster.
Just click the button below to download.
Click here to download the repeatability test cheatsheet & calculator for free!
CONCLUSION
Performing a repeatability test is the most common method used to collect type A uncertainty data.
If your laboratory is ISO/IEC 17025 accredited or plans to get accredited, you need to perform repeatability testing and include the results in your uncertainty budgets.
Additionally, make sure to keep records of your repeatability tests. Assessors are beginning to ask for evidence of these records during ISO/IEC 17025 audits (when reviewing uncertainty budgets).
In this guide, you should have learned how to:
- perform a repeatability test,
- calculate measurement repeatability, and
- add repeatability to your uncertainty budget.
Plus, you should have learned additional tips to help you complete the process with more confidence.
Calculating repeatability is not hard, but it is a task that some people find difficult to complete which leads to a lot of questions.
I hope you find this guide helpful, and it answered many of your questions. Use the information and tools provided in this guide to help you evaluate measurement repeatability and estimate uncertainty for ISO/IEC 17025.
If you have any questions or feedback, let me know.
This article was originally published on June 11,2018 and updated January 23,2024.

10 Comments