From my observations, laboratories are having a difficult time calculating and estimating measurement uncertainty. One of the most common problems that I encounter is laboratories are not performing variability studies (i.e. collecting type A data, Gauge R&R, etc.). As a result, there is very little data to generate confident estimates of uncertainty in measurement results.
Today, Accreditation Bodies (AB) require that random uncertainty contributors are included in the estimation of Calibration and Measurement Capability (CMC) statements. Laboratories that exclude these factors may receive a notification of non-conformance (e.g. deficiency). To resolve this issue and prepare you for your next assessment, I will show you how to collect, record, and analyze the data needed to properly quantify your random uncertainty contributors.
What is the goal?
The goal is to collect enough data to quantify the following parameters;
01 | Repeatability – The basic short-term precision for a measurement system
02 | Reproducibility – The day-to-day variability for a measurement system
03 | Stability – The run-to-run variability for a measurement system
How to collect the data?
Using a nested experiment design, we will be able to effectively evaluate variability at three levels.
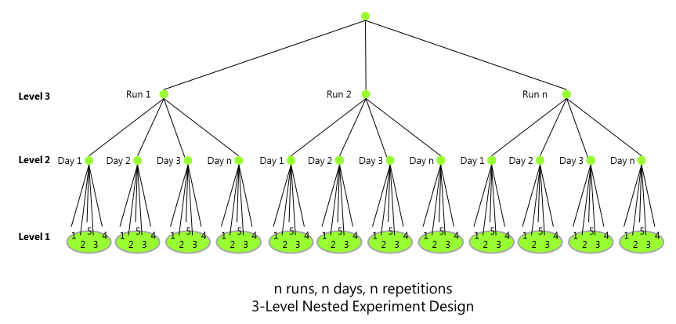
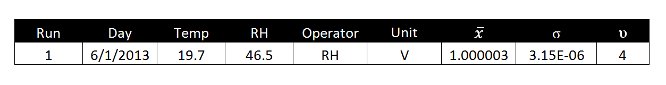
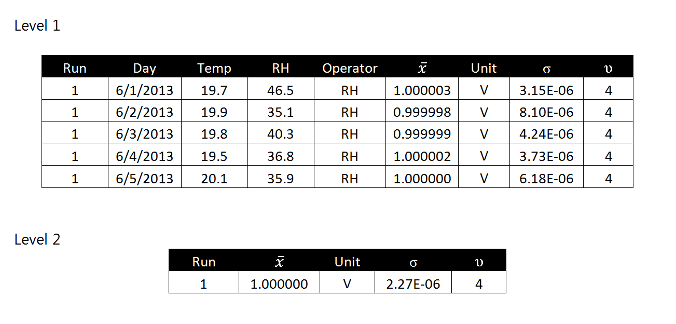
Level 1: Repeatability
Perform ‘n’ number of replicate measurements and record the results. Calculate the mean, the standard deviation, and the degrees of freedom for the data set. Record the results as shown below.
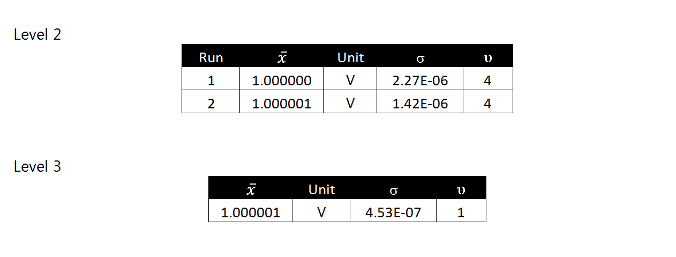
Level 2: Reproducibility
Repeat the level 1 experiments (repeatability) for ‘n’ number of consecutive days and record the results. This will be identified as ‘Run 1.’ Calculate the mean, the standard deviation, and the degrees of freedom of all the means recorded in level 1. Record the results in a new table, named Level 2, as shown.
Level 3: Stability
Repeat the level 1 and level 2 experiments for ‘n’ number of runs and record the results. Calculate the mean, the standard deviation, and the degrees of freedom of all the means recorded in Level 2. Record the results in a new table, named Level 3, as shown.
How to analyze the data?
For level 1, repeatability, use the method of ‘pooled variance’ to calculate the repeatability (s1) and the degrees of freedom from the recorded values of standard deviation.
For level 2, reproducibility, use the method of ‘pooled variance’ to calculate the reproducibility (s2) and the degrees of freedom from recorded values of standard deviation.
For level 3, stability, use the recorded values of standard deviation and the degrees of freedom to quantify stability (s3).

Now that we have identified an experiment design and covered how to collect, record, and analysis our Type A data, I encourage you to create a procedure and put this practice to use. Afterward, email me at [email protected] and provide some feedback. Tell me what you like, what you dislike, offer suggestions, and share this with your colleagues. Your input will be used to modify and improve the process. Furthermore, it will help me finish developing my next professional paper.