Introduction
Each time that you begin an uncertainty analysis, you need to create an outline before you start to estimate uncertainty.
I call this process specifying your measurement function. It is the first step in my 7 Steps to Estimating Measurement Uncertainty Guide. However, it is simply creating an outline for your uncertainty analysis.
The goal of this process is to help you focus on estimating uncertainty for one measurement function and one measurement range at a time. Ultimately, it will help you save time and avoid mistakes.
When you know where to focus your attention, it is easier to start estimating uncertainty and finish the process.
Similar to other laboratory activities, you need a procedure to complete a test or calibration. However, you need to know which procedure to use. If you outline what you are testing or calibrating, the process becomes much easier.
Uncertainty Analysis: Create An Outline
Each time you perform an uncertainty analysis you should create an outline by performing the following steps;
- Select the measurement function,
- Select the measurement range,
- Select the test points,
- Select the method,
- Select the equipment, and
- Find the mathematical equation or formula.
In the sections below, you will learn how to perform each of these steps in more detail.
1. Select the Measurement Function
The first thing that you want to do when starting to estimate uncertainty is to identify what you are doing.
Therefore, you need to specify your measurement function.
Just ask yourself, “What am I doing?”
Think about the process that you are performing and the results that you will record. How would you describe them?
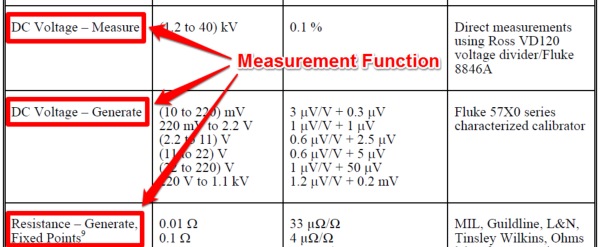
For example, maybe you are;
- Measuring DC voltage with a digital multimeter,
- Generating DC voltage with a multifunction calibrator,
- Measuring temperature with a thermometer,
- Measuring frequency with a counter,
- Calibrating pipettes with a precision balance,
There are many different activities that your laboratory could perform. You just need to briefly describe what you are doing.
Then, you will summarize the process in just a few words. Using the list above, some common names that you could use would be;
- DC Voltage Measure,
- DC Voltage Generate,
- Temperature Measure,
- Frequency Measure,
- Volume Measure
Additionally, you can describe what you are testing or calibrating. For example, you can specify your measurement function as;
- Scales,
- Pipettes,
- PRT Thermometers,
- Gage Blocks,
- Flowmeters
For inspiration, you should look at other laboratory’s scopes of accreditation to see what they are naming measurement functions.
This will ensure that you are using function names and descriptions that have been approved by your accreditation body.
Another good piece of advice would be to use names and descriptions that your customers will recognize.
Your scope of accreditation is an advertising document. It provides your customers with information about your laboratory’s capabilities. Make sure that your customers can understand what your laboratory does and how it can meet their requirements.
Therefore, start every uncertainty analysis by creating an outline and specifying your measurement function so you know where to focus the attention.
2. Select the Measurement Range
The next thing that you want to do is select your measurement range.
This will help you determine the range of values that your uncertainty analysis will cover so your focus is kept between these two values.
It’s about setting boundaries.
For example, your measurement functions could have one of the following ranges;
- (0 to 100) V,
- (0 to 250) °C,
- (1 to 100) Hz,
- (100 to 1,000) µL,
- (0.1 to 1) in
If you are having a hard time determining the measurement range, try looking the equipment manufacturer’s specifications. You should be able to find this information in manufacturer’s manuals and datasheets.
Typically, the specification sheets will list all of the ranges of the equipment’s measurement capability.
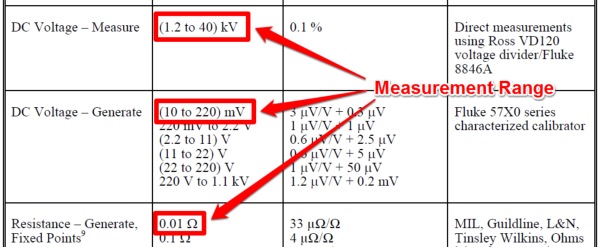
To determine the equipment’s measurement range;
- Find the smallest value of the range,
- Find the largest value of the range, and
- List of the range from smallest to largest.
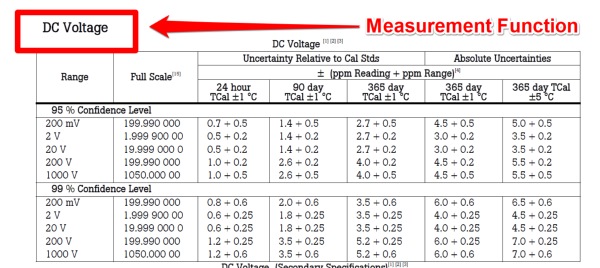
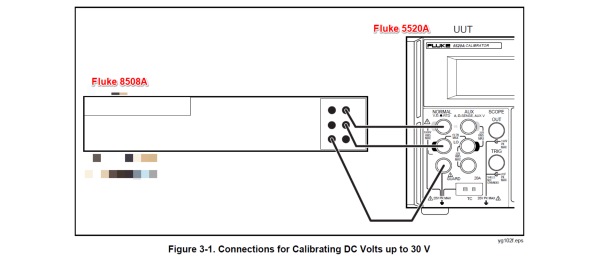
Look at the image above, you should be able to identify the following ranges;
- (0 to 200) mV
- (0 to 2) V
- (0 to 20) V
- (0 to 200) V
- (0 to 1000) V
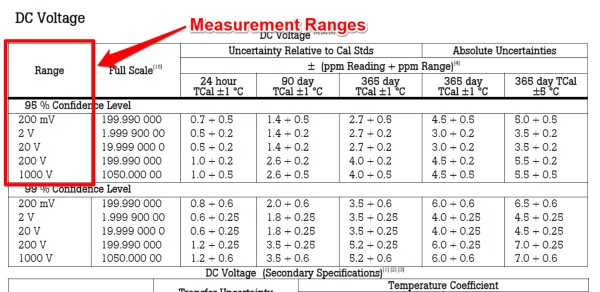
Alternatively, you can list the measurement ranges similar to how they will be presented in your scope of accreditation;
- (0 to 200) mV
- (0.2 to 2) V
- (2 to 20) V
- (20 to 200) V
- (200 to 1000) V
In this example, you are listing your measurement ranges where they are typically used and crossover to the next range.
The key takeaway is to make sure that you cover your system’s measurement capability.
However, use common sense when listing your measurement range. Your estimated uncertainty in measurement may not adequately represent equipment’s measurement capability below 5% of the range.
For example, your measurement equipment may not perform well at 0.1% of the measurement range in comparison to 100% of the range.
Typically, measurement equipment is recommended to be used from 10% or 20% of the measurement range to 100% of the range. Therefore, using equipment at 1% or less of the measurement range may not be desirable.
Make sure that you read manufacturer’s specifications and instructions.
3. Select the Test Points
Now that you have identified your measurement function and range, it is time to select the test points that you will use to estimate measurement uncertainty.
To select test points for estimating measurement uncertainty;
- Select a test point at the low end of the range,
- Select a test point at the high end of the range, and
- If necessary, select a test point in the middle of the range.
As a minimum, you will need to select two test points, one low and one high.
It is quite common to select test points at 10% and 100% of the range or 20% and 100% of the range.
The best practice is to select test points where your equipment is calibrated. Take a look at your calibration reports and find two points per range (i.e. one low and one high).
If your equipment is not calibrated at two points per measurement range, then you may need to estimate uncertainty at your cross-over points. This is where one measurement range overlaps with the next measurement range.
For example, a digital multimeter has five measurement ranges (e.g. 0.1V, 1V, 10V, 100V, and 1,000V) and is only calibrated at one point per range.
In this situation, it is best to estimate uncertainty at each calibration point and use the data from the previous range to calculate CMC uncertainty equations.
To estimate uncertainty for the 10V range, you would use the uncertainty at 10V and at 1V to develop a cmc uncertainty equation. This would allow you to estimate uncertainty at two points across the measurement range by using crossover or overlapping test points.
4. Select the Method or Procedure
To estimate measurement uncertainty for a test or calibration process, you need to know the process.
Therefore, you need to select the method or procedure that will be used to perform the process.
With the method, you can review the process to find sources of uncertainty from the;
- List of recommended equipment,
- Recommended environmental conditions,
- Steps of the process,
- Equations used to obtain results, and/or
- Precautionary notes to avoid errors.
Reading the test method or calibration procedure can be very beneficial to your uncertainty analysis and help you avoid mistakes in your estimation.
5. Select the Test Equipment
You should select your test equipment before beginning an uncertainty analysis. This will ensure that you choose the right equipment to adequately estimate uncertainty in measurement.
It is a good idea to select your best equipment or the equipment that you would typically use.
Selecting inferior or substandard equipment can significantly affect your uncertainty analysis results.
If your goal is to report less uncertainty and you are measuring DC Voltage, selecting a Keysight 3458A multimeter may be a better choice than a 34401A multimeter.
If you are measuring length and have similar goals, selecting a grade 1 gauge block may be a better choice than a grade 3 gauge block.
So, make sure to pick the right test equipment for your uncertainty analysis.
6. Find the Mathematical Equation or Formula
Another task that you should perform is finding the mathematical equation or formula that represents your measurement process.
It is a step that many people often overlook when estimating uncertainty. However, using the mathematical equation can significantly help you.
When available, I recommend that you use the mathematical equation when estimating uncertainty in measurement.
Mathematical equations are like a map. They can;
- Give you sources of uncertainty,
- Reduce the time you spend conducting research,
- Help you calculate sensitivity coefficients, and
- Ensure that you are appropriately estimating uncertainty.
With an equation, you should be able to find what components contribute to measurement uncertainty and determine how each variable contributes to the uncertainty of the test or measurement result.
Additionally, you can use the equation to perform simulations and a calculate sensitivity coefficients.
I highly recommend that you use equations when they are available.
For example, if you are estimating uncertainty for a dead weight tester, you can use the mathematical equation below.
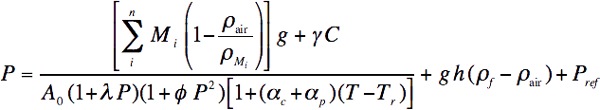
As you can see, this equation has a lot of variables. However, if you quantify the uncertainty for each variable, you can estimate uncertainty for the calculated pressure.
Furthermore, you do not have to worry (as much) about understating uncertainty because you have considered all of the sources of uncertainty included in the equation.
So, make sure to spend some time to find and use the mathematical equation (if available).
Information Needed for Uncertainty Analysis
After establishing what you will be estimating uncertainty for, you need to prepare yourself to begin a new uncertainty analysis.
Before you start, you need to collect information and data that will help you estimate measurement uncertainty.
I recommend that you gather the following items listed below;
- Last 3 calibration reports,
- Repeatability and reproducibility test results,
- Test method or calibration procedure,
- Equipment manuals and datasheets.
This should not be a difficult task. You should have all of these items readily available to you with little or no research.
The purpose of this task is to give you a process that will help you prepare to estimate uncertainty in measurement.
Uncertainty Analysis Example
Instead of ending this guide here, I want to give you some examples of this process so you can see how to implement it when you perform uncertainty analysis.
DC Voltage Measure with a Fluke 8508A
For this example, imagine that you want to estimate uncertainty for your Fluke 8508A digital multimeter.
To outline your uncertainty analysis, you need to:
- Identify the measurement function,
- Identify the measurement range,
- Identify the test points,
- Identify the method,
- Identify the equipment,
- Record your results
1. Identify the measurement function
Which measurement function of the multimeter will you be using?
Additionally, you will want to whether you are sourcing, generating, or measuring.
For this example, you will be measuring DC Voltage. Therefore, your measurement function would be title: DC Voltage Measure.
2. Identify the Measurement Range
Which measurement range do you want to evaluate?
Even though you want to estimate uncertainty each range, you should only pick one at a time.
For this example, let’s pick the 200mV range.
To specify the measurement range from beginning to end, identify the lowest and highest points of the range.
Some examples that you can use may include;
- Up to 200mV
- 1mV to 200mV
- 0.000001mV to 200mV
However, be realistic. List the measurement range that you actually intend to use.
3. Identify the Test Points
What test points will you use to estimate uncertainty?
At a minimum, pick two test points across the range. I would recommend one low test point and one high test point.
Look at your calibration reports. I would recommend using test points that have calibration results. It will be much easier to estimate uncertainty at these points.
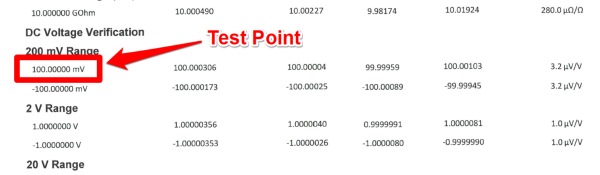
For this example, the multimeter is only calibrated at 100mV. Therefore, I would estimate uncertainty at 0mV and 100mV.
Otherwise, I recommend that you pick test points that are close to 10% of the range and 100% of the range.
For the next range (i.e. 2V), I would use your uncertainty at 100mV for the low test point and estimate uncertainty at 1V for your high test point.
4. Identify the Method
Which method do you use to measure DC Voltage?
Select the method that best represents your typical workload or laboratory activities.
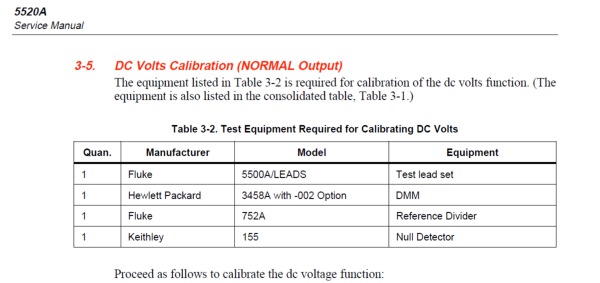
For this example, the manufacturer’s calibration procedure was chosen for measuring DC Voltage from a multifunction calibrator.
5. Identify the Equipment
What equipment will you use?
Select the equipment that will provide your best measurement capability or your most common measurement capability.
I recommend that you select equipment that will provide your best measurement capability because you cannot report uncertainty that is smaller than advertised in your scope of accreditation.
For this example, a Fluke 8508A Multimeter was selected since it provides the best measurement capability for our hypothetical laboratory.
Additionally, I have selected a multifunction calibrator to act as the unit under test since it will help provide smaller uncertainties for repeatability and reproducibility.
If I had selected to use a power supply as my UUT, the results of repeatability and reproducibility testing would have been much larger which would lead to a larger uncertainty estimate.
So, make sure to select equipment (i.e. STD and UUT) with the best measurement capability. It will help achieve smaller uncertainties.
6. Recording Your Results
Now, that you have completed the previous five steps, you can record the results in your uncertainty budgets.
I recommend that you list the following information;
- Measurement function,
- Equipment or system description,
- Equipment identification or serial numbers,
- Measurement range, and
- Test-point
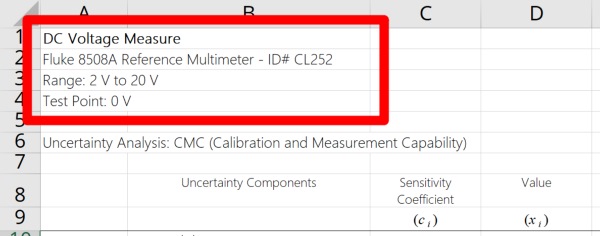
Take a look at the image below to see an example. This is the way that I present information in every uncertainty budget that I create.
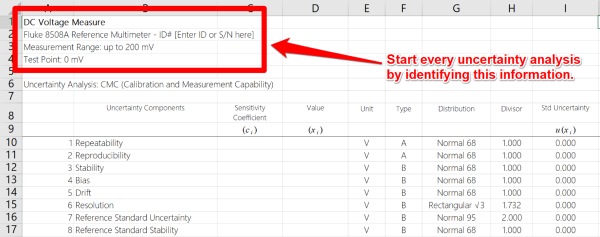
It gives you a great outline for your uncertainty analysis.
Using this format provides all of the important information that you or your assessor need to understand what section of your scope of accreditation is related to this uncertainty budget.
Furthermore, it will help you keep your focus and attention on the one analysis at a time.
More Uncertainty Analysis Examples
Here are some more examples of specifying your measurement function and outlining your uncertainty analysis.
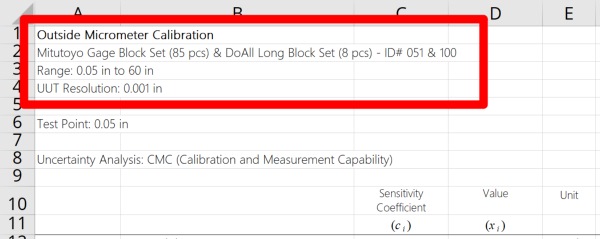
Length Measure / Gauge Blocks
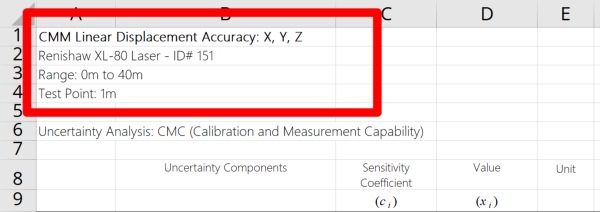
Length / CMM
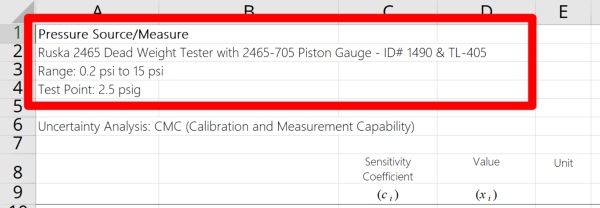
Pressure Measure
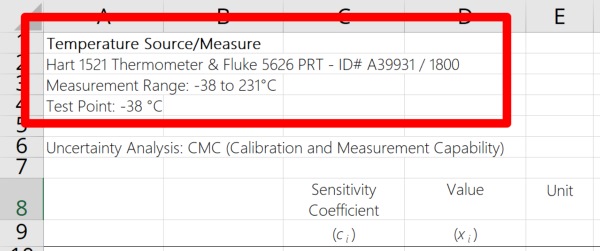
Temperature Measure
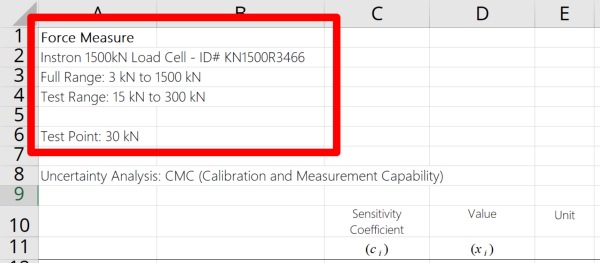
Force Measure
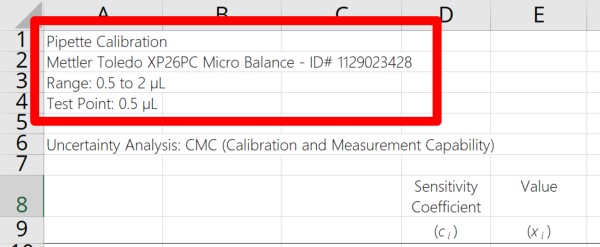
Volume Measure / Pipettes
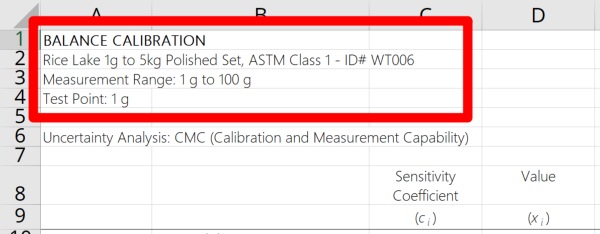
Mass / Scales
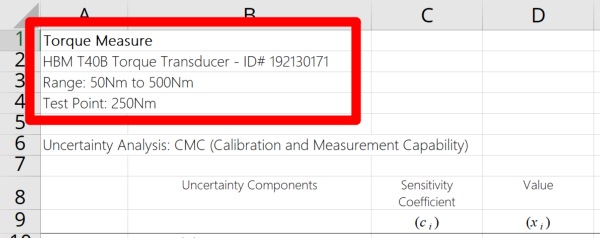
Torque Measure
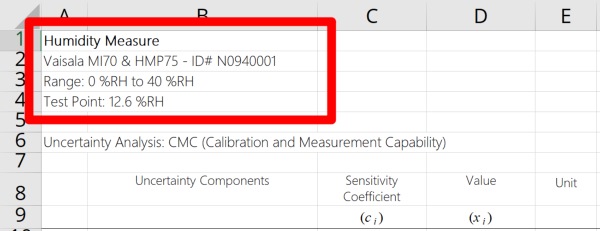
Humidity Measure
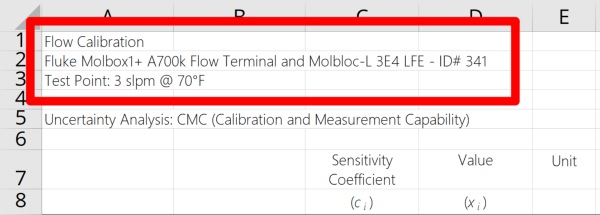
Flow Measure
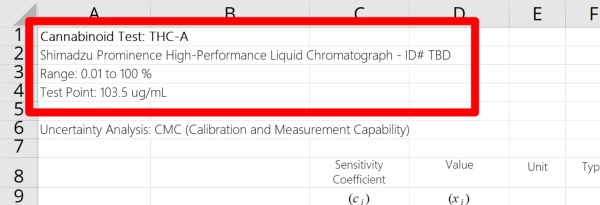
Cannabinoids
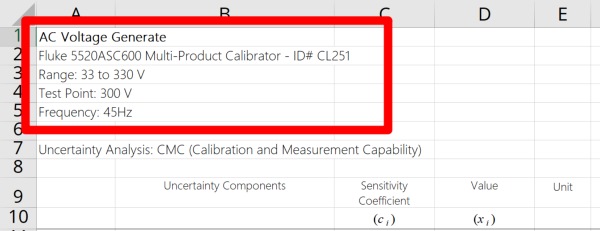
AC Voltage Generate
DC Voltage Measure
As you can see, the format for outlining each uncertainty analysis is quite consistent. It contains the following information (in order);
- Measurement Function/Parameter,
- Equipment or System Description,
- Measurement Range, and
- Test-Point or Nominal Value
Therefore, I recommend that you use a similar format when outlining your uncertainty analyses.
Conclusion
Outline each uncertainty analysis when you begin to estimate uncertainty. It will help you focus your analysis on the right function, system, and data. Additionally, it will prevent you from making mistakes.
When you identify the key elements of your uncertainty analysis, it will help you narrow your scope of work and eliminate information and data that is not relevant.
Another benefit of outlining your analysis is it will allow you and others (e.g. assessors) to understand which measurement function is associated with each uncertainty budget. Plus, it will make it easier to organize your budgets in relation to your scope of accreditation.
Outlining your analysis and specifying a measurement function may not make sense to you today, but it is helpful when you look at your uncertainty budgets a year or two from now.
Whether you are updating your budgets or trying to answer an assessor’s question about your results, you will be glad you outlined your uncertainty analysis.
Therefore, make sure you start every uncertainty analysis with an outline of your measurement function. You will not regret it.

One Comment