Short Answer: Measurement repeatability is a statistical evaluation of variability in replicate measurement results on the same or similar object over a short period of time under the same measurement conditions, including the same procedure, operators, measuring system, operating conditions and location.
Official VIM Definitions Related to Measurement Repeatability
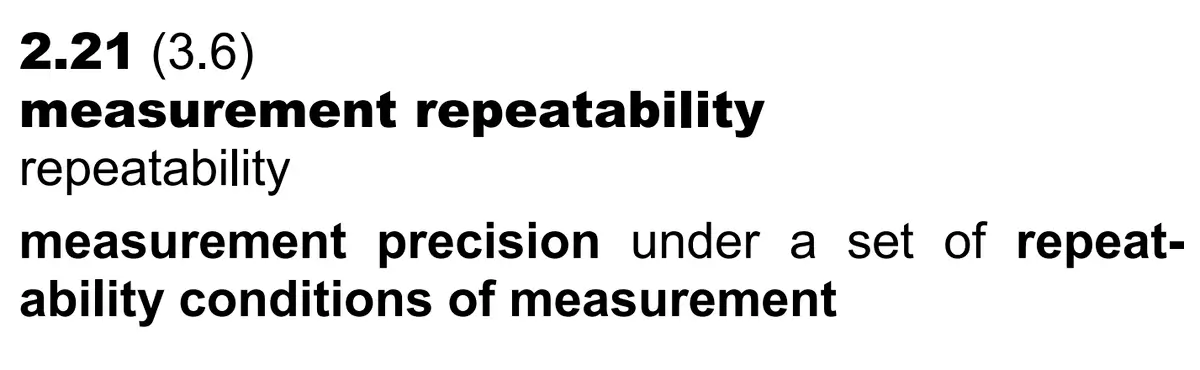
Measurement Repeatability
According to the Vocabulary in Metrology (JCGM 200:2012), measurement repeatability is measurement precision under a set of repeatability conditions of measurement.
The key to understanding repeatability – and avoiding bad advice – is defining repeatability conditions of measurement.
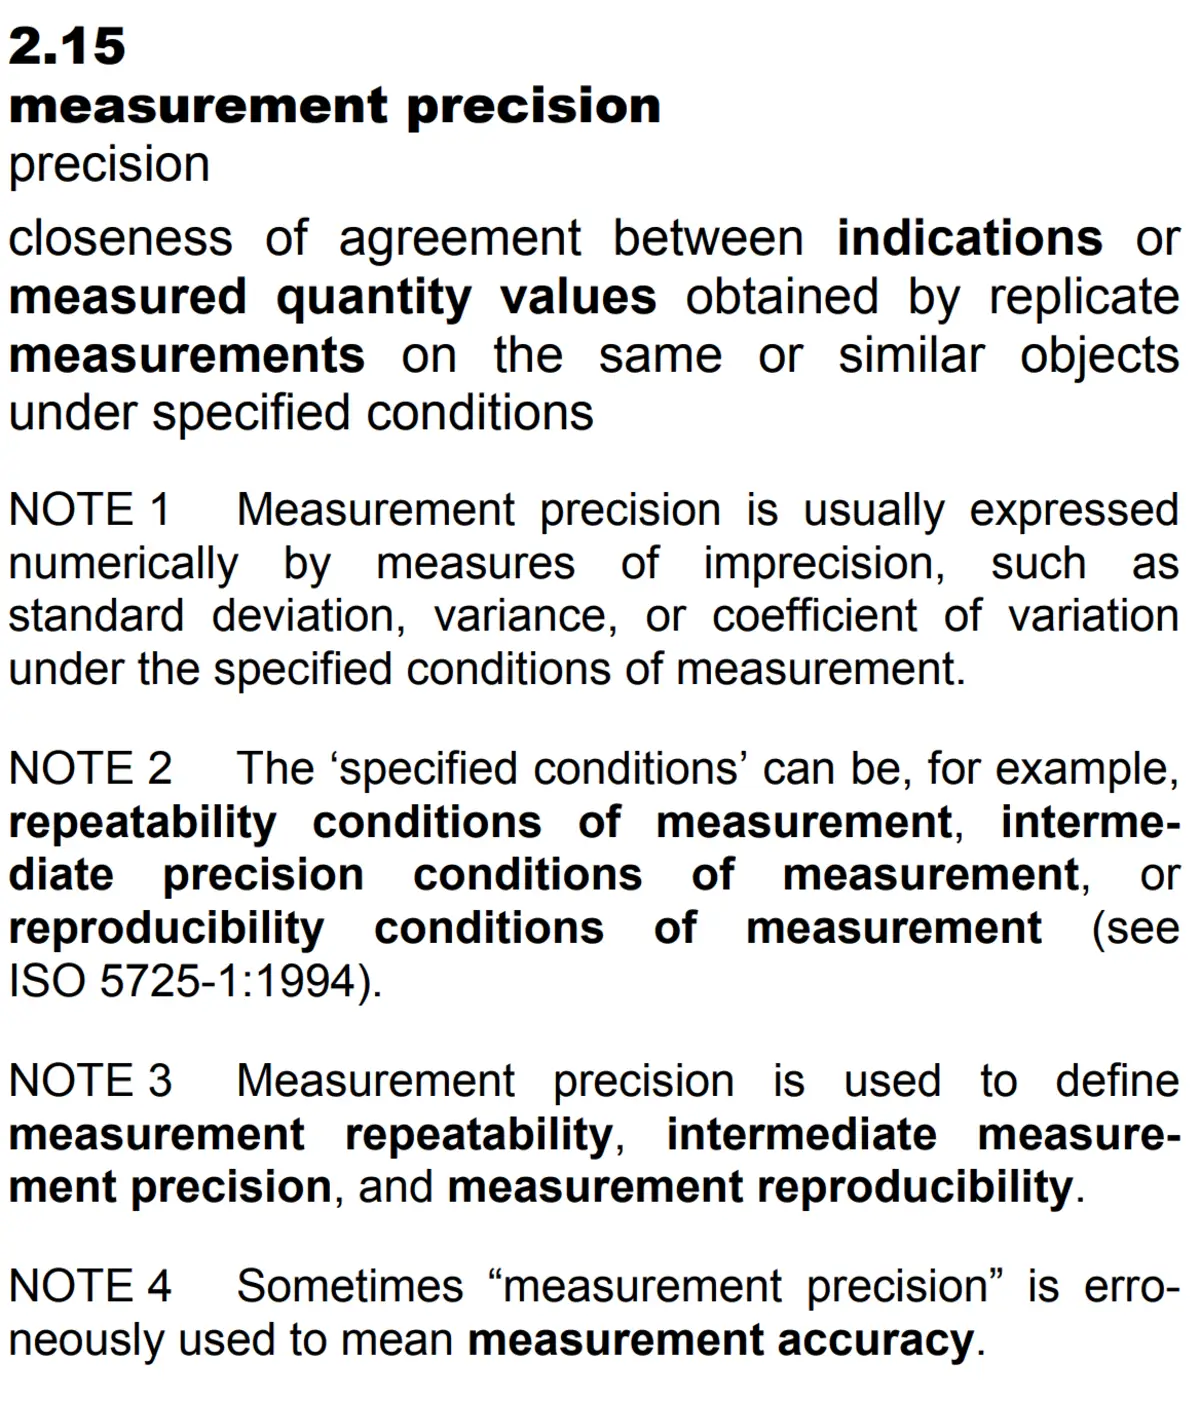
Measurement Precision
According to the Vocabulary in Metrology (JCGM 200:2012), measurement precision is the closeness of agreement between indications or measured quantity values obtained by replicate measurements on the same or similar objects under specified conditions.
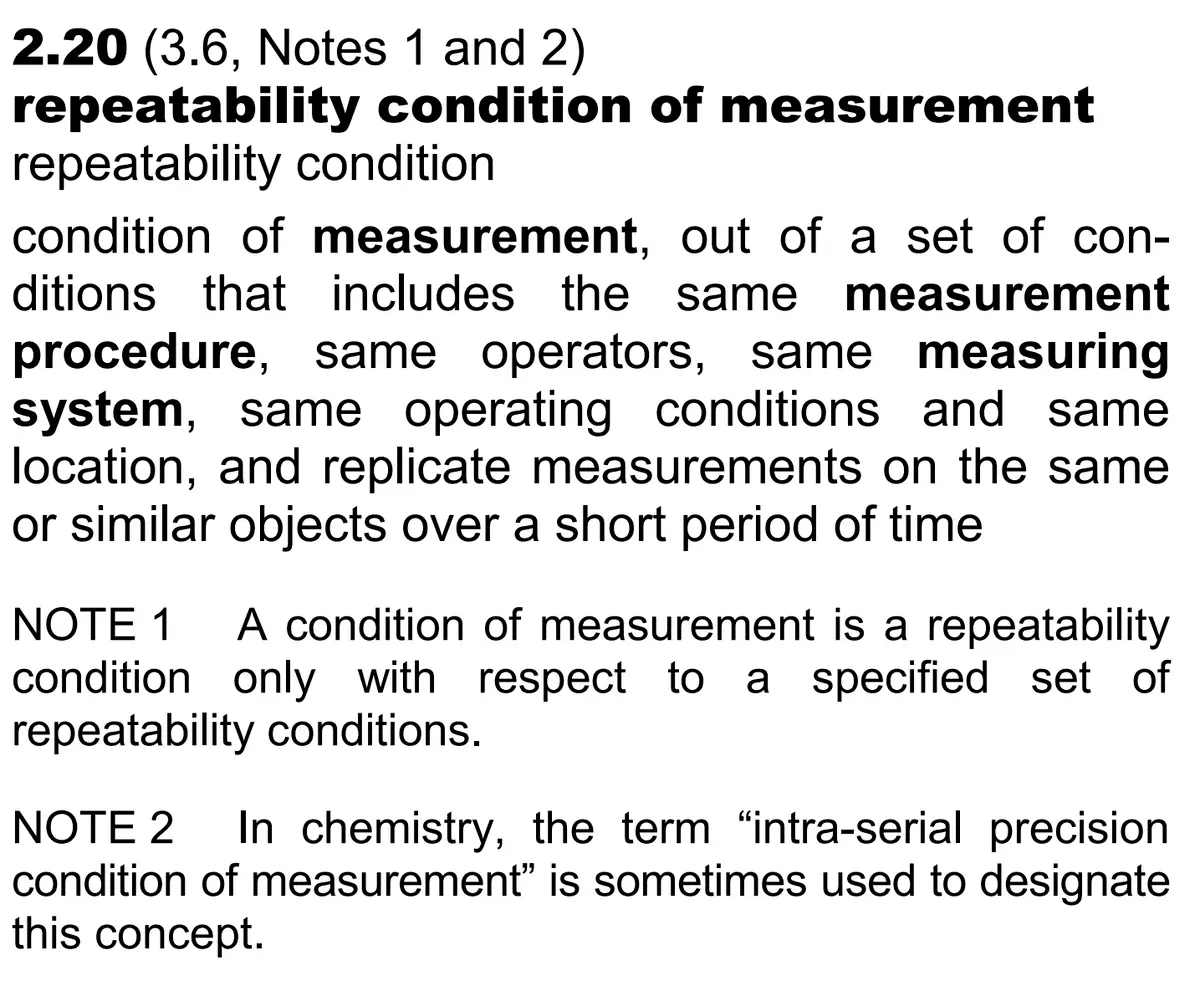
Repeatability Conditions of Measurement
According to the Vocabulary in Metrology (JCGM 200:2012), repeatability condition of measurement is condition of measurement, out of a set of conditions that includes the:
- same measurement procedure,
- same operators,
- same measuring system,
- same operating conditions and
- same location, and
- replicate measurements on the same or similar objects over a short period of time
Based on the definition, all conditions must stay the same and repeated measurements must occur on the same of similar items over a short period of time.
Therefore, you should not disassemble your measurement setup between each measurement – regardless of what someone advises you. Disassembling and reassembling the measurement system would be a reproducible event (i.e. reproducibility test), not a repeatable event.
Instead, perform measurements back-to-back (i.e. one after the other) changing nothing about your process. Keep everything the same or consistent with previous measurements.
FAQ
How to Calculate Repeatability?
Follow these steps to calculate repeatability.
- Repeat a measurement “n” number of times under the same or similar conditions over a short period of time.
- Record the results.
- Calculate the sample standard deviation “s” of the recorded results.
- Determine the number of observations “n” made in the final test or calibration result.
- Single observation: n = 1
- Average of two observations: n = 2
- Average of three observations: n = 3
- Average of five observations: n = 5
- Average of 10 observations: n = 10
- Divide the standard deviation by the square root of the number of observations made in the final result.
If repeatability needs to be evaluated for two or more data sets (e.g. repeatability results from different operators), use the method of pooled variance per ISO 5725-2 and JCGM 100:2008, section H.3.5.
Additional methods for calculating repeatability can be found in this article, “How to Perform a Repeatability Test for Estimating Uncertainty in Measurement.”
What if repeatability is zero?
Repeatability cannot be zero. It is likely that the item performing the measurement lacks enough resolution to observe the variance in repeated results.
In this scenario, the JCGM 100:2008 section F.2.2.1 recommends using the resolution of the measurement device to estimate the uncertainty by dividing the resolution by the square-root of 12 or multiplying the resolution by 0.29.
If all repeated measurements are the same (i.e. no variation), then divide the resolution by the square-root of 12.
How many samples to collect for repeatability?
Perform 20 to 30 repeated measurements, where appropriate. Otherwise, perform as many repeated measurements as possible based on the availability of time, cost, and resources.
The number of samples to collect during a repeatability test is highly debated. Typically, most experts recommend performing 20 to 30 repeated measurements. This coincides with many scholarly resources for statistical significance.
However, every measurement process is different. In some scenarios, repeated measurements can impacted time, cost, and the availability of resources. Therefore, there are scenarios when 20 repeated measurements not feasible resulting in the laboratory performing fewer repeated measurements, such as 5 to 10.
On the contrary, there are systems where performing repeated measurements is very simple and not constrained by resources. Therefore, the laboratory may be able to easily perform 100 or more repeated measurements.
What is the difference between repeatability and reproducibility?
The major difference is the measurement conditions.
Repeatability tests are performed under the same or similar measurement conditions while reproducibility tests are performed under different measurement conditions.
What is the standard deviation of the mean?
The standard deviation of the mean is the standard deviation of the average or mean measurand. It is calculated by dividing the standard deviation by the square root of the number of observations in the average or mean reported result.
It is covered in the JCGM 100:2008 (GUM), sections 4.2.4 and Table E.1.
This evaluation is often misused to evaluate repeatability testing results by dividing the standard deviation by the square root of the number of samples in the repeatability test. This is incorrect and will lead to underestimation of uncertainty.
The number of observations must be based on the number of samples in the final result reported in accredited certificates. Therefore, the final reported result must be the average or mean of multiple measurements.
For example, ISO 8655-6 requires pipette calibration be performed using 10 repeated samples to calculate the average volume. In this scenario, there are 10 observations made to determine the final reported result. So, the repeatability standard deviation can be divided by the square root of 10.
Typically, many measurements are performed and reported based on one, single measurement. Therefore, the repeatability standard deviation would be divided by the square root of one because the final reported result is based on a single measurement.
How to handle outliers in repeatability data?
Handling outliers in repeatability data in a highly debated topic with several statistical techniques that can be applied to determine and remove outliers.
Some experts assert that outliers should never be removed.
I disagree, so long as appropriate statistical techniques are applied. There are many academic and industrial resources that provide recommended techniques to identify and remove outliers.
Two of the most commonly recommended techniques, include the Grubbs and Dixon Q Test.
Method #1: Grubbs Test
It measures how far the suspected outlier is from the sample mean in units of the sample standard deviation.
- x_i represents the individual measurement data points.
- \bar{x} is the calculated sample mean.
- s is the sample standard deviation.
Method #2: Dixon Q Test
This method compares the distance of the suspected outlier from its nearest neighbor to the total range of the data set.
- x_1 is the minimum value in the dataset.
- x_2 is the second-smallest value.
- x_{n-1} is the second-largest value.
- x_n is the maximum value in the dataset.
- The denominator (x_n - x_1) represents the total range of the dataset.
Glossary
- Measurement Repeatability
- measurement precision under a set of repeatability conditions of measurement (JCGM 200:2012, 2.21).
- Measurement Reproducibility
- measurement precision under reproducibility conditions of measurement (JCGM 200:2012, 2.25).
- Measurement Precision
- closeness of agreement between indications or measured quantity values obtained by replicate measurements on the same or similar objects under specified conditions (JCGM 200:2012, 2.15).
- Repeatability Conditions of Measurement
- condition of measurement, out of a set of conditions that includes the same measurement procedure, same operators, same measuring system, same operating conditions and same location, and replicate measurements on the same or similar objects over a short period of time (JCGM 200:2012, 2.20).
- Mean
- a measure of central tendency that represents the average or center of a data set or collection of numbers.
- Standard Deviation
- a measure of spread, variation, or dispersion of values about its mean by calculating the square root of a variance.
- Pooled Standard Deviation
- a measure of the square root of the weighted average of individual variances from two or more data sets.
- Variance
- a measure of the average squared difference between each data point and the mean.
- Grubbs Test
- a statistical method used to detect a single outlier in a univariate dataset that assumes an approximately normal distribution (NIST SEMATECH, 1.3.5.17.1).
- Dixon’s Q Test
- a statistical method used to identify and reject single outliers in small, normally distributed datasets (NIST Dataplot)