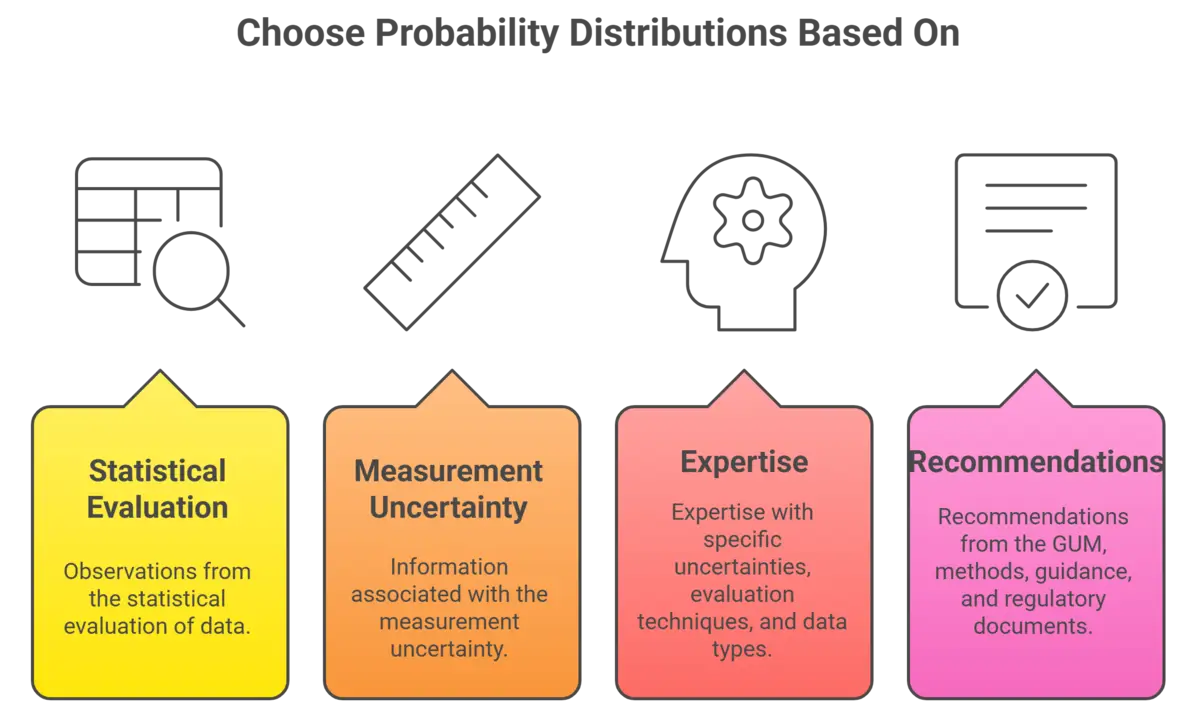
Short Answer: Some uncertainties are assumed to be normally distributed based on:
- Observations from the statistical evaluation of data,
- Information associated with the measurement uncertainty,
- Expertise with specific uncertainties, evaluation techniques, and data types, or
- Recommendations from the GUM, methods, guidance, and regulatory documents.
If a normal distribution is not appropriate, then another probability distribution will be chosen to characterize the uncertainty.
Observations from Statistical Evaluation
Many times, data is evaluated using the Analysis of Variance (ANOVA) to determine the mean and standard deviation. According to the Empirical Rule, it is easy to assume this type of evaluation will be normally distributed.
Furthermore, statistical techniques, such as a histogram, allow you to visualize the behavior of outcomes within a dataset. According to the Central Limit Theorem, if enough samples are collected, the distribution of data will take the form of a normal distribution regardless of any underlying distribution.
Information Associated with the Measurement Uncertainty
Other times, uncertainties are expressed with information to help you assume a normal distribution. For example, an uncertainty may be given to a specific confidence interval or coverage factor.
Likewise, it may include details to inform you the uncertainty is the combination of individual uncertainties. According to the Central Limit Theorem, the combination of multiple probability distributions will result in a normal distribution even if the individual distributions are all different. Evidence of three rectangular distributions combining to make a normal distribution can be found in section G.2.1 of the JCGM 100:2008.
Expertise with Uncertainties, Evaluation Techniques, and Data Types
Personnel with expertise related to specific uncertainties, evaluation techniques, and data types can easily make assumptions of the expected probability distribution. Knowledge and experience with previous uncertainty analyses and evaluation techniques allow you to easily recall which probability distribution is appropriate. Most of these assumptions are the result of other evaluations described in this section.
Recommendations from the GUM, Methods, Guidance, and Regulatory Documents
When estimating uncertainty, probability distributions can be assumed based on recommendations from the JCGM 100:2008 (GUM), sections 4.2 and 4.3. Otherwise, assumptions are made based on information from standard methods, guidance documents and regulatory documents. Scholarly sources, such as textbooks, are valuable resources but not as frequently used (even though they should be).
Many standard methods, guidance, and regulatory contain information to specify how uncertainty should be evaluated, including what probability distributions should be used to characterize individual uncertainties and convert them to standard uncertainties.
Recommendations from the GUM
According to the JCGM 100:2008, probability distributions are assigned based on:
- Type A evaluations: a series of observations or experience, or
- Type B evaluations: priori knowledge, assumptions, or arguments.
Many probability distributions can be assumed based on statistical evaluations or scientific judgement. Otherwise, you can use criteria-based recommendations given in the GUM or JCGM 100:2008. References are provided below.
- Normal Distribution: use this distribution when uncertainties meet the criteria given in the JCGM 100:2008, sections 4.2.2, 4.2.4, 4.2.5, 4.3.3, 4.3.4, 4.3.5, 4.3.6, F.2.3.3, G.1.6, or G.2.
- Rectangular Distribution: use this distribution when uncertainties meet the criteria given in the JCGM 100:2008, sections 4.3.7 or 4.3.8
- Triangular Distribution: use this distribution when uncertainties meet the criteria given in the JCGM 100:2008, sections 4.3.9 or F.2.3.3
Normal Distribution
| Type | GUM | Criteria |
|---|---|---|
| A | 4.2.2 | Uncertainty is the standard deviation of individual observations |
| A | 4.2.5 | Uncertainty of a curve-fitted model and predicted points |
| B | 4.3.3 | Uncertainty stated to a multiple of a standard deviation |
| B | 4.3.4 | Uncertainty stated to a confidence interval |
| B | 4.3.5 | 50/50 or 50% chance input value lies in the interval |
| B | 4.3.6 | 2/3 or 67% chance input value lies in the interval |
| B | G.2.1 | Uncertainty is a combination of individual uncertainty contributors |
Rectangular Distribution
| Type | GUM | Criteria |
|---|---|---|
| B | 4.3.7 | Uncertainty only estimated by limits, no knowledge of possible values of X |
| B | 4.3.8 | Asymmetric tolerance intervals missing enough information to select an appropriate distribution |
Triangular Distribution
| Type | GUM | Criteria |
|---|---|---|
| B | 4.3.9F.2.3.3 | Uncertainty only estimated by limits, with knowledge of possible values of X being closer to center than limits |
FAQ
How do you choose the right probability distribution for uncertainty (normal, rectangular, triangular)
To choose the right probability distribution for each source of uncertainty, refer to sections 4.2 and 4.3 of the JCGM 100:2008. It includes criteria-based recommendations for selecting the right probability distributions. Otherwise, use a histogram, expertise, or published studies to find the right probability distribution.
Probability Distribution Recommendations from the GUM (JCGM 100:2008)
Normal Distribution – recommended for the following scenarios:
- Type A Uncertainties (GUM: 4.2.1 through 4.2.4)
- Curve-fit Uncertainty (GUM: 4.2.5)
- Uncertainty stated to a multiple of a standard deviation (GUM: 4.3.3)
- Uncertainty stated to a confidence interval (GUM: 4.3.4)
- 50/50 chance input value lies in the interval (GUM: 4.3.5)
- 2 in 3 chance input value lies in the interval (GUM: 4.3.6)
- Uncertainty is a combination of individual uncertainties (GUM: G.2.1)
Rectangular Distribution – recommended for the following scenarios:
- Uncertainty only estimated by limits with no knowledge of possible values of X withing the interval (GUM: 4.3.7)
- Asymmetric tolerance intervals missing information to select an appropriate distribution (GUM: 4.3.8)
Triangular Distribution – recommended for the following scenarios:
- Uncertainty only estimated by limits, with knowledge of possible values of X being closer to center than limits (GUM: 4.3.9 & F.2.3.3)
How are different uncertainty distributions handled when combining uncertainties?
Each uncertainty is converted to a standard deviation equivalent and combined using the square root of the sum of squares formula (known as the RSS method).
According to the Central Limit Theorem, when multiple uncertainties (each with their own distribution) are combined, the resulting distribution will be approximately normal.
Therefore, when different distributions are combined using the RSS method, the combined standard uncertainty will have a normal distribution. According to the JCGM 100:2008 section G.2.2, even three rectangular distributions combined using the RSS method will result in a normal distribution.
Glossary
- Probability Distribution
- a function or table that describes the likelihood of all possible outcomes for a random variable associated with an experiment or event.
- Normal Distribution
- a probability distribution that is symmetric and bell-shaped with most values centered about the mean and it’s height and width based on the standard deviation.
- Rectangular Distribution (Uniform Distribution)
- a probability distribution that looks like a rectangle where every outcome has an equal chance of occurring within the defined range.
- Triangular Distribution
- a probability distribution that looks like a triangle and is defined by a minimum, maximum, and most likely value (i.e. mode).
- Central Limit Theorem
- a concept in probability theory where the distribution of sample means will take the shape of a normal distribution regardless of the underlying distribution if the sample size is large enough.
- Empirical Rule
- a statistical principle that states for a normal distribution, approximately 68.27 % of outcomes will occur within one standard deviation, 95.45 % of outcomes will occur within two standard deviations, and 99.73 % of outcomes will occur within three standard deviations.
- Type A Uncertainty
- evaluation of a component of measurement uncertainty by a statistical analysis of measured quantity values obtained under defined measurement conditions (Source: JCGM 200:2012, 2.28)
- Type B Uncertainty
- evaluation of a component of measurement uncertainty determined by means other than a Type A evaluation of measurement uncertainty (Source: JCGM 200:2012, 2.29)
- Coverage Factor
- – number larger than one by which a combined standard measurement uncertainty is multiplied to obtain an expanded measurement uncertainty. (Source: JCGM 200:2012, 2.38)
- Level of Confidence
- the likelihood that a set of measurement values are contained within a specified coverage interval. (Source: JCGM 200:2012, 2.37)