Probability Distribution Recommendations from the GUM (JCGM 100:2008)
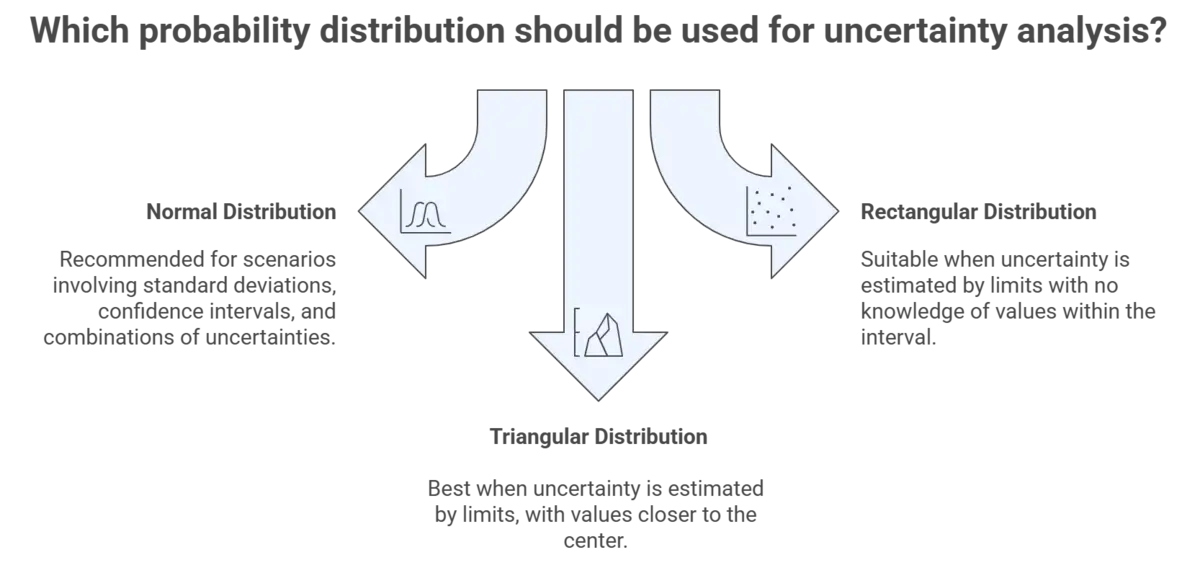
Normal Distribution – recommended for the following scenarios:
- Type A Uncertainties (GUM: 4.2.1 through 4.2.4)
- Curve-fit Uncertainty (GUM: 4.2.5)
- Uncertainty stated to a multiple of a standard deviation (GUM: 4.3.3)
- Uncertainty stated to a confidence interval (GUM: 4.3.4)
- 50/50 chance input value lies in the interval (GUM: 4.3.5)
- 2 in 3 chance input value lies in the interval (GUM: 4.3.6)
- Uncertainty is a combination of individual uncertainties (GUM: G.2.1)
Rectangular Distribution – recommended for the following scenarios:
- Uncertainty only estimated by limits with no knowledge of possible values of X withing the interval (GUM: 4.3.7)
- Asymmetric tolerance intervals missing information to select an appropriate distribution (GUM: 4.3.8)
Triangular Distribution – recommended for the following scenarios:
- Uncertainty only estimated by limits, with knowledge of possible values of X being closer to center than limits (GUM: 4.3.9 & F.2.3.3)
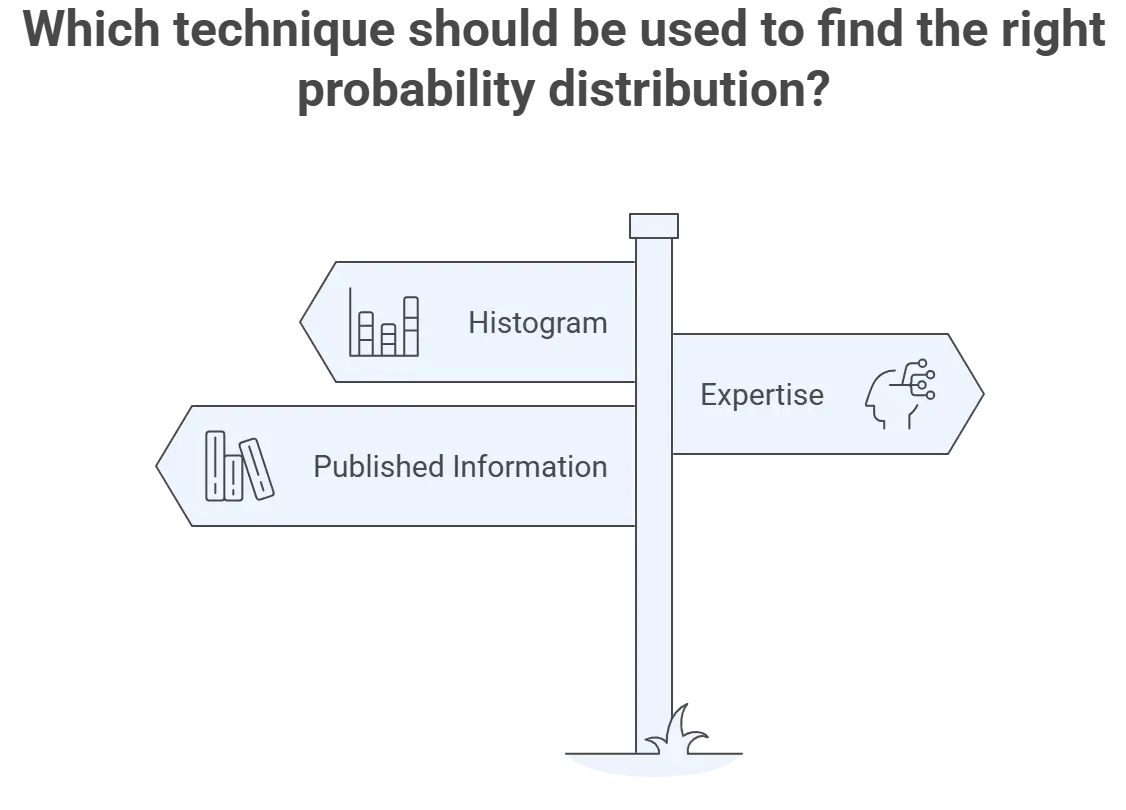
Techniques to Find the Right Probability Distribution
Histogram – a statistical technique the generates a diagram (e.g. bar chart) to show the frequency of occurrence of all outcomes in a data set. They are used to estimate the probability distribution.
Expertise – experience and expertise with particular sources of uncertainties can help select the right probability distribution.
Published Information – credible sources of information can help identify the right probability distribution to use for a component of measurement uncertainty. Common examples of published information include: specifications, studies, papers, articles, books, guidance documents, and other uncertainty budgets.
Other Common Probability Distributions
U-shaped Distribution – a distribution that represents outcomes are more likely to occur near the limits than the center. It is commonly used to represent mismatch uncertainty in RF Power measurements and temperature uncertainty of a thermostat controller.
Rayleigh Distribution – a distribution that characterizes the resulting vector of two normally distributed vector quantities. It is commonly used to represent mismatch uncertainty in RF Power measurements and any uncertainty associated with its directional components (e.g. x and y) that produce an uncertainty in the resulting vector (e.g. z) such as force, velocity, and displacement.
Log-Normal Distribution – a distribution that characterizes the function of a natural logarithm that normally distributed. It is commonly used for asymmetric tolerance limits, Microbiology plate counts, particle size, and measurements constrained by physical limits.
Probability Distribution Summary Tables based on the GUM
Normal Distribution
| Type | GUM | Criteria |
|---|---|---|
| A | 4.2.2 | Uncertainty is the standard deviation of individual observations |
| A | 4.2.5 | Uncertainty of a curve-fitted model and predicted points |
| B | 4.3.3 | Uncertainty stated to a multiple of a standard deviation |
| B | 4.3.4 | Uncertainty stated to a confidence interval |
| B | 4.3.5 | 50/50 or 50% chance input value lies in the interval |
| B | 4.3.6 | 2/3 or 67% chance input value lies in the interval |
| B | G.2.1 | Uncertainty is a combination of individual uncertainty contributors |
Rectangular Distribution
| Type | GUM | Criteria |
|---|---|---|
| B | 4.3.7 | Uncertainty only estimated by limits, no knowledge of possible values of X |
| B | 4.3.8 | Asymmetric tolerance intervals missing enough information to select an appropriate distribution |
Triangular Distribution
| Type | GUM | Criteria |
|---|---|---|
| B | 4.3.9F.2.3.3 | Uncertainty only estimated by limits, with knowledge of possible values of X being closer to center than limits |
FAQ
Why are some uncertainties assumed to be normally distributed while others are not?
Probability distributions are assigned based on:
- Type A evaluations: a series of observations or experience, or
- Type B evaluations: priori knowledge, assumptions, or arguments.
Many probability distributions can be assumed based on statistical evaluations or scientific judgement. Otherwise, you can use recommendations given in the GUM or JCGM 100:2008. References are provided below.
- Normal Distribution: use this distribution when uncertainties meet the criteria given in the JCGM 100:2008, sections 4.2.2, 4.2.4, 4.2.5, 4.3.3, 4.3.4, 4.3.5, 4.3.6, G.1.6, or G.2.
- Rectangular Distribution: use this distribution when uncertainties meet the criteria given in the JCGM 100:2008, sections 4.3.7 or 4.3.8
- Triangular Distribution: use this distribution when uncertainties meet the criteria given in the JCGM 100:2008, sections 4.3.9 or F.2.3.3
How are different uncertainty distributions handled when combining uncertainties?
Each uncertainty is converted to a standard deviation equivalent and combined using the square root of the sum of squares formula (known as the RSS method).
According to the Central Limit Theorem, when multiple uncertainties (each with their own distribution) are combined, the resulting distribution will be approximately normal.
Therefore, when different distributions are combined using the RSS method, the combined standard uncertainty will have a normal distribution. According to the JCGM 100:2008 section G.2.2, even three rectangular distributions combined using the RSS method will result in a normal distribution.
Glossary
- Probability Distribution
- a function or table that describes the likelihood of all possible outcomes for a random variable associated with an experiment or event.
- Normal Distribution
- a probability distribution that is symmetric and bell-shaped with most values centered about the mean and it’s height and width based on the standard deviation.
- Rectangular Distribution (Uniform Distribution)
- a probability distribution that looks like a rectangle where every outcome has an equal chance of occurring within the defined range.
- Triangular Distribution
- a probability distribution that looks like a triangle and is defined by a minimum, maximum, and most likely value (i.e. mode).
- Central Limit Theorem
- a concept in probability theory where the distribution of sample means will take the shape of a normal distribution regardless of the underlying distribution if the sample size is large enough.
- Empirical Rule
- a statistical principle that states for a normal distribution, approximately 68.27 % of outcomes will occur within one standard deviation, 95.45 % of outcomes will occur within two standard deviations, and 99.73 % of outcomes will occur within three standard deviations.
- Type A Uncertainty
- evaluation of a component of measurement uncertainty by a statistical analysis of measured quantity values obtained under defined measurement conditions (Source: JCGM 200:2012, 2.28)
- Type B Uncertainty
- evaluation of a component of measurement uncertainty determined by means other than a Type A evaluation of measurement uncertainty (Source: JCGM 200:2012, 2.29)