In the image below, you will see this explained in the JCGM 100:2008, section 5.1.2.

According to the Central Limit Theorem, when multiple uncertainties (each with their own distribution) are combined, the resulting distribution will be approximately normal.
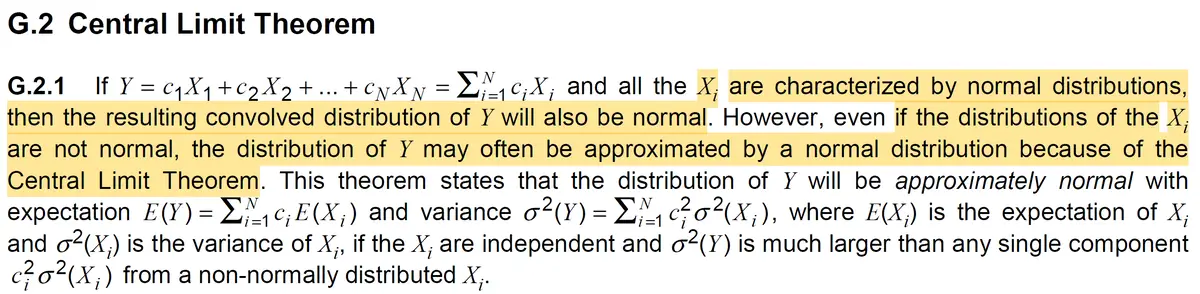
See the image below for an excerpt from the JCGM 100:2008, Appendix G.2.1.
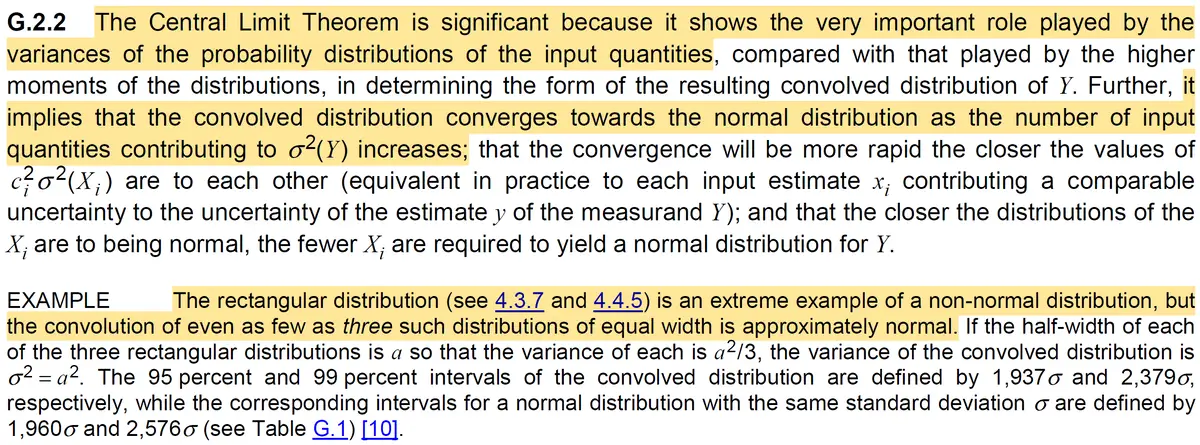
Therefore, when different distributions are combined using the RSS method, the combined standard uncertainty will have a normal distribution. According to the JCGM 100:2008 section G.2.2, even three rectangular distributions combined using the RSS method will result in a normal distribution.
See the image below for an excerpt from the JCGM 100:2008, Appendix G.2.2. Read the example at the bottom of the image. It is highlighted so you can easily find it.
How to Combine Uncertainties with Different Distributions
Follow the instructions below to calculate the combined standard uncertainty.
- Find the divisor associated with each uncertainty and it’s probability distribution.
- Convert each uncertainty to a standard uncertainty – Divide each uncertainty by its divisor.
- Convert each standard uncertainty to a variance – Square each standard uncertainty.
- Calculate the sum of squares – Add together all the squared uncertainties (i.e. variances).
- Calculate the square root of the sum of squared uncertainties (i.e. total variance).
For more information, refer to the JCGM 100:2008 section 5.
FAQ
Why are some uncertainties assumed to be normally distributed while others are not?
Probability distributions are assigned based on:
- Type A evaluations: a series of observations or experience, or
- Type B evaluations: priori knowledge, assumptions, or arguments.
Many probability distributions can be assumed based on statistical evaluations or scientific judgement. Otherwise, you can use recommendations given in the GUM or JCGM 100:2008. References are provided below.
- Normal Distribution: use this distribution when uncertainties meet the criteria given in the JCGM 100:2008, sections 4.2.2, 4.2.4, 4.2.5, 4.3.3, 4.3.4, 4.3.5, 4.3.6, G.1.6, or G.2.
- Rectangular Distribution: use this distribution when uncertainties meet the criteria given in the JCGM 100:2008, sections 4.3.7 or 4.3.8
- Triangular Distribution: use this distribution when uncertainties meet the criteria given in the JCGM 100:2008, sections 4.3.9 or F.2.3.3
How do you choose the right probability distribution for uncertainty (normal, rectangular, triangular)
To choose the right probability distribution for each source of uncertainty, refer to sections 4.2 and 4.3 of the JCGM 100:2008. It includes criteria-based recommendations for selecting the right probability distributions. Otherwise, use a histogram, expertise, or published studies to find the right probability distribution.
Probability Distribution Recommendations from the GUM (JCGM 100:2008)
Normal Distribution – recommended for the following scenarios:
- Type A Uncertainties (GUM: 4.2.1 through 4.2.4)
- Curve-fit Uncertainty (GUM: 4.2.5)
- Uncertainty stated to a multiple of a standard deviation (GUM: 4.3.3)
- Uncertainty stated to a confidence interval (GUM: 4.3.4)
- 50/50 chance input value lies in the interval (GUM: 4.3.5)
- 2 in 3 chance input value lies in the interval (GUM: 4.3.6)
- Uncertainty is a combination of individual uncertainties (GUM: G.2.1)
Rectangular Distribution – recommended for the following scenarios:
- Uncertainty only estimated by limits with no knowledge of possible values of X withing the interval (GUM: 4.3.7)
- Asymmetric tolerance intervals missing information to select an appropriate distribution (GUM: 4.3.8)
Triangular Distribution – recommended for the following scenarios:
- Uncertainty only estimated by limits, with knowledge of possible values of X being closer to center than limits (GUM: 4.3.9 & F.2.3.3)
Glossary
- Probability Distribution
- a function or table that describes the likelihood of all possible outcomes for a random variable associated with an experiment or event.
- Normal Distribution
- a probability distribution that is symmetric and bell-shaped with most values centered about the mean and it’s height and width based on the standard deviation.
- Rectangular Distribution (Uniform Distribution)
- a probability distribution that looks like a rectangle where every outcome has an equal chance of occurring within the defined range.
- Triangular Distribution
- a probability distribution that looks like a triangle and is defined by a minimum, maximum, and most likely value (i.e. mode).
- Central Limit Theorem
- a concept in probability theory where the distribution of sample means will take the shape of a normal distribution regardless of the underlying distribution if the sample size is large enough.
- Measurement Uncertainty
- non-negative parameter characterizing the dispersion of the quantity values being attributed to a measurand, based on the information used. (Source: JCGM 200:2012, 2.26)
- Type A Uncertainty
- evaluation of a component of measurement uncertainty by a statistical analysis of measured quantity values obtained under defined measurement conditions (Source: JCGM 200:2012, 2.28)
- Type B Uncertainty
- evaluation of a component of measurement uncertainty determined by means other than a Type A evaluation of measurement uncertainty (Source: JCGM 200:2012, 2.29)
- Standard Measurement Uncertainty
- measurement uncertainty expressed as a standard deviation. (Source: JCGM 200:2012, 2.30)
- Combined Standard Measurement Uncertainty
- standard measurement uncertainty that is obtained using the individual standard measurement uncertainties associated with the input quantities in a measurement model. (Source: JCGM 200:2012, 2.31)
- Measurand
- quantity intended to be measured. (Source: JCGM 200:2012, 2.3)