
One of the most frequently asked questions that I receive is “How do I convert my uncertainty estimates to a formula?” In my last post, I showed you how to calculate CMC Uncertainty using the equations in your scope of accreditation. Now, I am show you have to reduce your uncertainty estimates to an equation.
I am a big advocate of using equations for my CMC uncertainty. I believe equations better represent the uncertainty of a range and function. Fixed value uncertainty estimates are better suited for fixed point reference values. Equations provide an uncertainty value that changes with the value of the range.
In this post, I am going to show you two methods to develop a mathematical equation to represent your uncertainty. The first method is interpolation.
Method 1: Interpolation
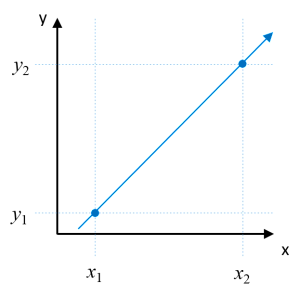
The quickest and simplest way to calculate uncertainty equations is interpolation between two points. Remember when your grade school teacher made you calculate the slope and y-intercept to solve for the line equation? Well, this is it. If you know ‘x’ and ‘y,’ you can solve for gain and offset. This is called interpolation between two points.
1. Find Max and Min Points
The first task to solving our linear equation is to identify the minimum and maximum points of our function. Now, determine the minimum and maximum values of ‘x’ and ’y.’
where,
x1 = minimum input variable
x2 = minimum input variable
y1 = maximum output variable
y2 = maximum output variable
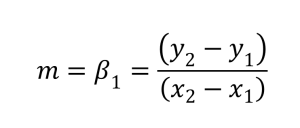
2. Calculate Gain
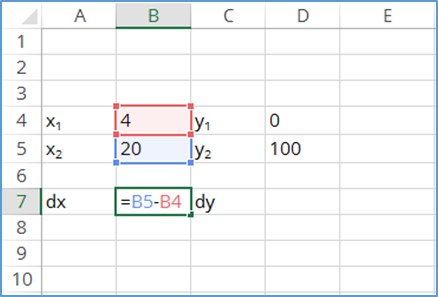
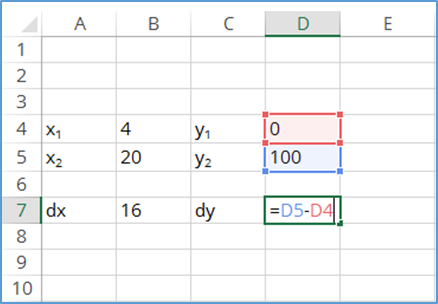
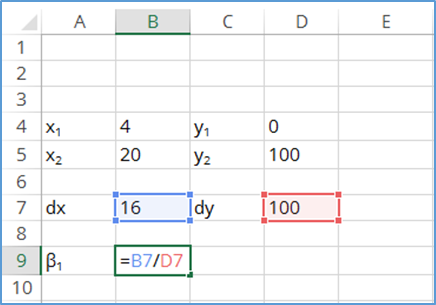
Now that you have identified the maximum and minimum values of ‘x’ and ‘y,’ calculate the slope or gain coefficient. This is accomplished by finding the difference of ‘y’ and the difference of ‘x.’ Then, divide the difference of ‘y’ by the difference of ‘x.’ You have just calculated the gain coefficient which represents the rate of change for the value of y based in the input value of x. Use the formula below as a guide.
Need additional help? I will show you how to do it in MS Excel.
3. Calculate Offset
After calculating the gain coefficient, it’s time to solve for the offset coefficient. To accomplish this, multiply the gain coefficient by the minimum value of x. Then, subtract this value from the minimum value of y. Use the equation below as a guide.
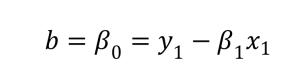
Once again, let’s do it in MS Excel.
Hopefully, I made it easy for you. This is a pretty simple process. If it seems difficult, follow the instructions I have provided and practice. Repetition is the key to learning to use this technique on command. You may find yourself using this method more often that you think. It’s so easy, I use it all the time; no regression algorithm or software needed. Soon enough, I believe you will too.
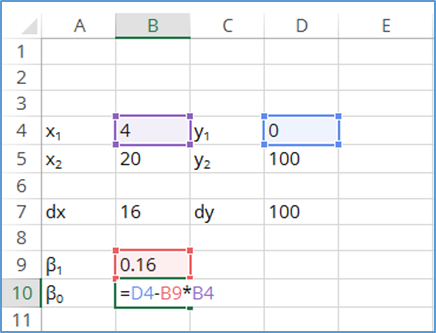
Interpolation vs Extrapolation
Interpolation and extrapolation are different. Solving for or inferring a value between two points is interpolation. Solving or inferring a value beyond these two points is extrapolation.
One point that I want to emphasize is to use your equations for interpolation only. This will help ensure confidence in your results. Using them for extrapolation can yield errors and larger uncertainty in your results.
Method 2: Regression
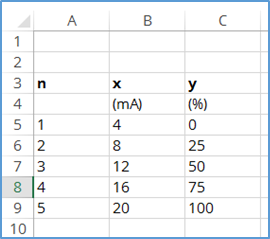
1. Pick Your Points
Pick points across the range that are evenly spaced to prevent errors. Some may argue that spacing test-points does not matter; but it does! Otherwise, most calibration procedures would not instruct you to test at 10%, 20%, or 25% intervals. This may be the case for a linear equation; however, if you practice this methodology for non-linear regression, you will quickly become and unhappy camper when verifying and graphing your verification data.
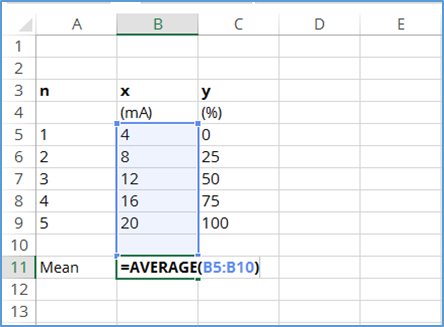
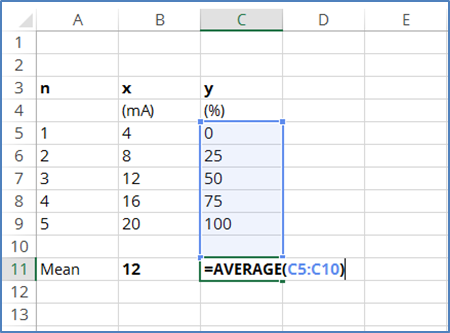
2. Find the Mean of x and y
Independently calculate the mean (i.e. average) of both x and y. Using the ‘average’ function in excel, you should be able to find the mean quickly. Just type ‘=average(,’ select the cells you want to calculate average, and close the parenthesis ‘).’ Use the images below as a guide.
3. Find the Difference from the Mean
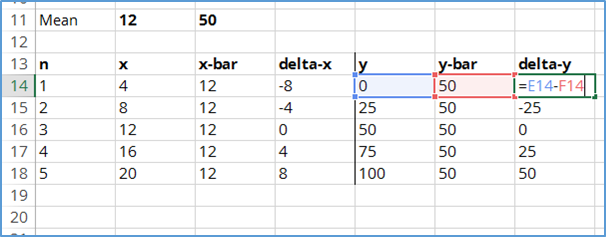
Now that you have calculated the mean of x and y, calculate the deltas (i.e. differences) from the mean of x and y. Subtract each ‘x’ value by the mean of x. In the image below, you will notice that I represent the mean with ‘x-bar’ and difference with ‘delta-x.’ Repeat this calculation for each value of x.
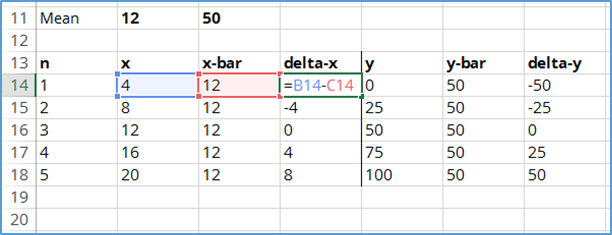
Next, subtract each ‘y’ value by the mean of y. In the image below, you will notice that I represent the mean with ‘y-bar’ and difference with ‘delta-y.’ Repeat this calculation for each value of y.
4. Calculate Gain
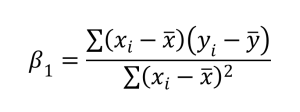
Now it is time to calculate the gain coefficient. I will show you how to use the equation below to calculate the gain.
5. Multiply dx and dy
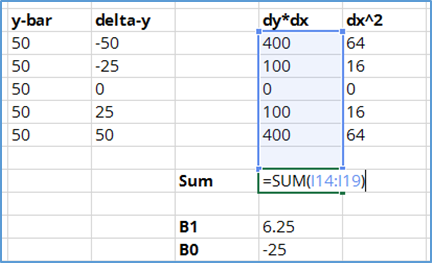
Find the product of delta-x and delta-y by multiplying them together. Repeat this for each value of delta-x and delta-y in series. Use the image below as a guide.
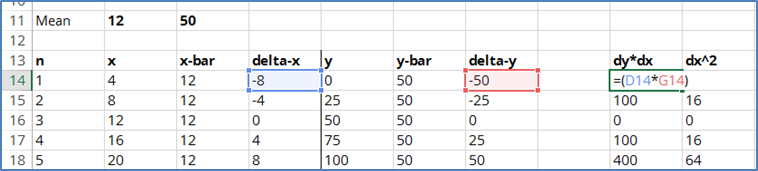
6. Square dx
Now, find the squared value of delta-x by multiplying dx by itself or using an exponent of 2. See the image below as a guide.
7. Sum the values
Find the summation of all the products and squares. First, add together all the values of dy*dx.
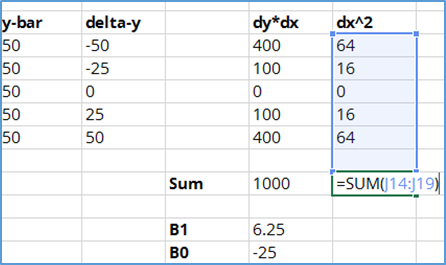
Next, add together all the values of dx^2.
8. Divide the Sum of Products by the Sum of Squares
Now, calculate the gain coefficient B1 by dividing the sum of dy*dx by sum of dx^2.
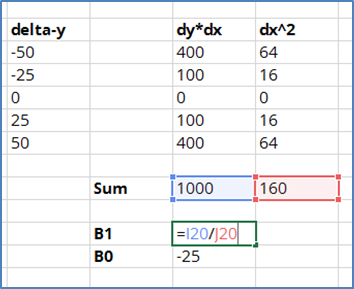
That’s it! You have successfully calculated the gain coefficient. Next, I will show you how to calculate the offset coefficient.
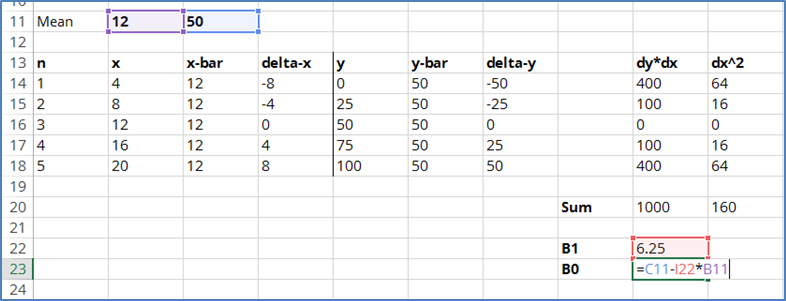
9. Calculate Offset
In this section, I will show you how to find the offset coefficient B0 using B1, the mean of x, and the mean of y. The equation that will need to use is below; but, I am am going to use MS Excel again to show you how calculate offset.
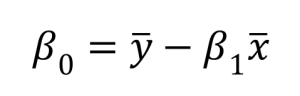
To calculate offset, multiply the gain coefficient and the mean of x. Afterward, subtract this calculated value from the mean of y. The result will the offset coefficient.
Verifying the Results
Now that you have used regression to calculate your CMC equation, you can use the following equation to verify that your new equation matches the original results of x and y. If so, you now have an equation that will allow you to confidently estimate uncertainty. If your equation does not fit the data, something is wrong or the data cannot be modeled using a linear equation.

To learn how to use this equation, read How to Calculate CMC Uncertainty Like A Pro.
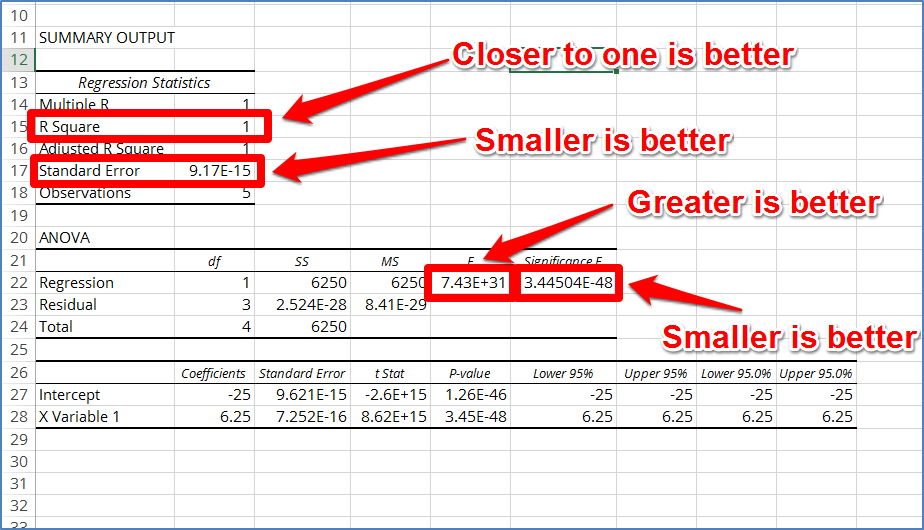
Determining Appropriateness or Fit
Beyond verifying the results, there are some other measures that can be used to determine whether or not the model will fit the data. One measure is to check the value of R2 or R-squared. The closer R-squared is to one, the more likely the data the model will fit the data. You can also evaluate the standard error of the model. When the standard error is small, the more likely the data the model will fit the data. Additionally, you can evaluate the standard error of the model to determine if the model is appropriate for your uncertainty analysis.
Another method is to evaluate the F-statistics. This is a great metric if you are comparing several models for a single data set. From my experience, the model with the greatest value of F and the smallest value of Significance F will have the best fit. However, it is best to graph the model over the data and determine if the model fits the data and is appropriate for use. Sometimes you will observe a model that fits the data perfectly, but it is not appropriate or realistic when you evaluate the graph.
If you enjoyed this article, subscribe to my newsletter to get updates when new articles are posted. Also, share this article with colleagues and friends who you think will benefit from reading this information.
Again, thank you for your emails, questions, and comments!