Collecting Data
Before you can analyze and evaluate the measurement system and process, you must collect some data. However, before diving in head first, there are some things that should be considered.
Review the Plan
First, review your plan. If you do not, you may find yourself repeating the experiment. It is more time efficient to do things right the first time. Identify what measurement functions, parameters, and ranges will be evaluated. Identify how you will perform the experiment by selecting your method. Finally, select the equipment you will need to perform the experiment.
Data Collection
Now that you have reviewed the plan, you need to determine what data you will collect and how you will collect it. This is important because good record-keeping practices will save you a lot of time later. Additionally, if you follow my advice, you will be able to perform further analysis, at a later time, to determine additional uncertainties that are influenced by the operator, the environment, and the passage of time.
The Checklist
I recommend developing a checklist for the data collection process. The checklist should identify the following information;
01| The parameter, function, and range(s) tested,
02| The equipment used and their associated identification numbers,
03| The date,
04| The operator,
05| The method,
06| The environmental conditions (e.g. temperature, humidity, etc.), and
07| The sample data collected.
Click Here To Get A FREE Repeatability Checklist
Analyzing the Results
Now that you have collected your data, you will need to use descriptive statistics to analyze the results. By calculating the following parameters, you should be able to learn more about the behavior of your measuring systems, equipment, and processes. This will be beneficial when performing uncertainty analysis.
Mean
The first parameter that should be calculated is the mean. The mean is the calculated average or central value of your measurement results. The mean is calculated by finding the sum of all the measured values and dividing it by the total number of samples collected.
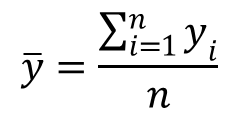
Excel function: =average(cell 1, cell 2,…,cell n)
Standard Deviation
The next parameter of interest is the standard deviation. The standard deviation is a measure of the variance or the dispersion of the set of data about the mean. A large standard deviation indicates that the data is broadly dispersed about the mean, and a small standard deviation infers that the data is narrowly clustered around the mean.
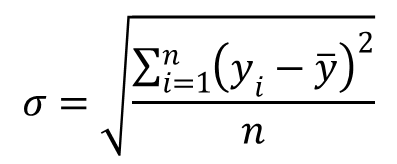
Excel function: =stdev(cell 1, cell 2,…,cell n)
Degrees of Freedom
After calculating the mean and standard deviation, you will want to know how many degrees of freedom are associated with your results. The degrees of freedom are the number of values of a statistical calculation which are free to vary. The greater the degrees of freedom, the more confident you should be about the final result.
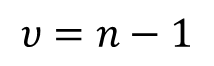
Excel function: =count(cell 1, cell 2,…,cell n)-1
Standard Deviation of the Mean
When evaluating the precision of the mean, it is common to calculate the standard deviation of the mean. This is accomplished by finding the quotient or the result of dividing the calculated standard deviation by the square root of the number of samples collected in a sample set. This is the uncertainty associated with the measurement results related to repeatability
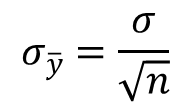
Excel function: =stdev(cell 1, cell 2,…,cell n)/sqrt(count(cell 1, cell 2,…,cell n)-1)
Now that you have performed a repeatability experiment, you should feel more confident the next time you repeat it or experiment with another measurement discipline. By experimenting with your actual measurement processes you will begin to understand and predict how they will perform. Furthermore, you will be able to evaluate and improve your processes to reduce the uncertainty in measurement associated with the results.

2 Comments