Introduction
Have you ever wondered what sources of uncertainty in measurement to include in your uncertainty budget? I have, and I am sure that you have too.
Today, I am going to show you 7 sources of uncertainty that should be included in every uncertainty budget. The reason you should include these uncertainty sources each time you estimate uncertainty is because they typically influence every measurement that you will ever make.
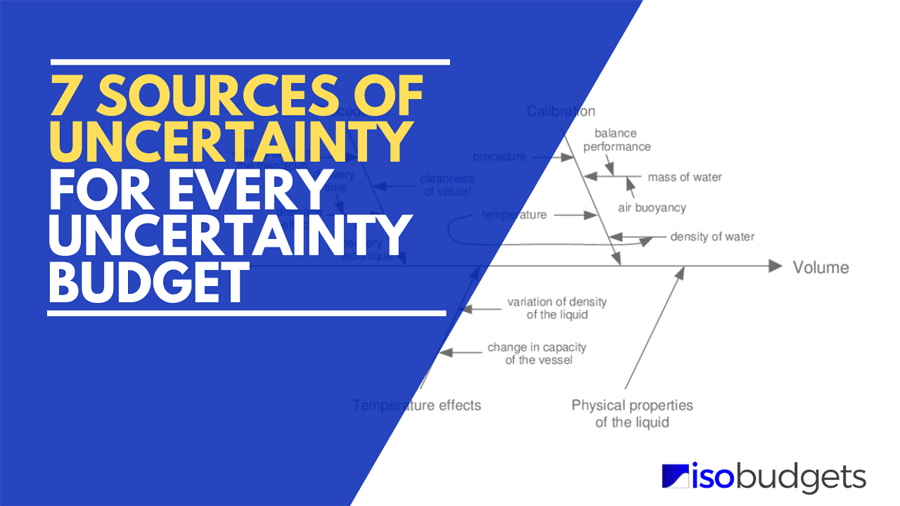
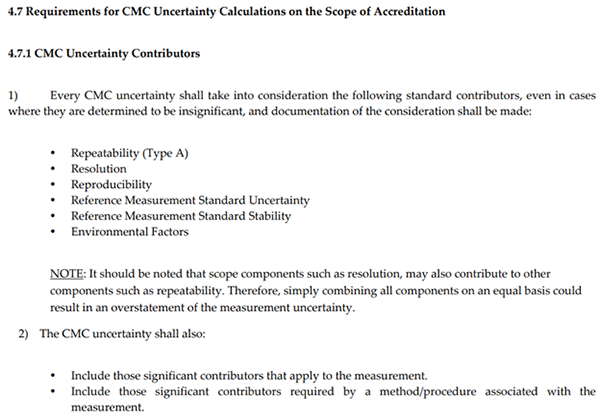
Another reason you should use them in your uncertainty budget is they are common uncertainty contributors required by many accreditation bodies. Look at the image below or read A2LA R205 Requirements Document and scroll down to section 4.7.1.
To help you create better uncertainty budgets and more appropriately estimate measurement uncertainty, I have created a list of 7 sources of uncertainty in measurement that should be in every uncertainty budget.
Furthermore, I am going to go beyond telling you what these uncertainty sources are, I am going to show you how to evaluate them and calculate their value using data that you already have.
Sources of Uncertainty
Measurement uncertainty can be influenced by many factors. However, these factors will belong to one of the 6 main categories that influence uncertainty in measurement.
Next time you begin an uncertainty analysis and search for sources of measurement uncertainty, start thinking about uncertainty contributors that are in these categories.
The 6 categories that influence uncertainty in measurement are:
- Equipment,
- Unit Under Test,
- Operator,
- Method,
- Calibration, and
- Environment.
Sources for Every Uncertainty Budget
In this guide, I am going to show you the 7 sources of Uncertainty in Measurement that should be included in every uncertainty budget. You will learn:
- What they are;
- How to calculate them; and
- Examples for applying them.
The 7 sources of uncertainty covered in this guide should be the main uncertainty contributors you begin every uncertainty analysis with. After you evaluate these 7 sources, you will need to consider other factors that contribute to the uncertainty of your test or calibration.
You will learn about this at the end of the guide.
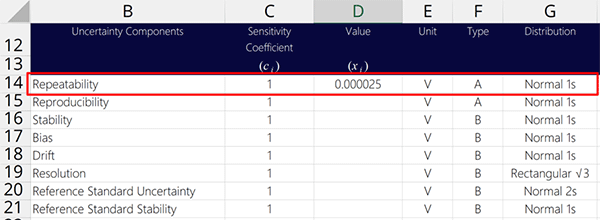
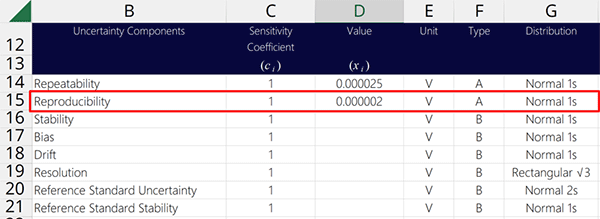
The 7 sources of Uncertainty in Measurement that should be included in every uncertainty budget are listed below:
In the sections below, you learn more about each one of these contributors to measurement uncertainty.
Click here to download the 7 sources of uncertainty calculator for free!
1. Repeatability
Repeatability is a source of uncertainty in measurement you should include in the every uncertainty budget. It is a Type A uncertainty that is characterized by a normal distribution where k=1.
You can test repeatability yourself by collecting repeated measurements under similar conditions (i.e. do not change anything). Next, evaluate repeatability by calculating the standard deviation and adding it to your uncertainty budget.
Most accreditation bodies require repeatability in every uncertainty analysis. If you do not include it in your uncertainty budget, you will most likely get a deficiency.
Keep reading to learn more about repeatability, including:
- What is the definition of repeatability?
- How to calculate repeatability?
- Repeatability example
- Common questions about repeatability
1.1 Definition of Repeatability
According to the Vocabulary in Metrology, repeatability in measurement is defined as:
1: Measurement precision under a set of repeatability conditions of measurement (2.20)
Look at the image below to see the definition in the VIM.
To simplify, repeatability is the variability in your measurement results under similar conditions. Everything in your process must stay the same with no changes to the equipment, operator, method, days, environment, etc. You should repeat each measurement under conditions as close as possible to the original result.
1.2 How Many Samples Should You Collect
How many samples you collect depends on your situation. Most people recommend you collect 20 to 30 samples. However, this does not work for every situation.
Some processes may allow you to collect 20 samples while other processes may only allow you to collect 3 to 5 samples. Only collect as many samples as you practically can given your situation. Use common sense and do not overthink how many samples you should collect.
However, you should know, according to the Central Limit Theorem, the more samples you collect will result in a smaller you standard deviation. So, collecting more samples will yield you a smaller uncertainty.
1.3 How to Calculate Repeatability
Calculating repeatability is easy for a single data set. Simply, record your results and calculate the standard deviation. That’s it.
Follow the instructions below to calculate repeatability:
- Repeat a measurement ‘n’ number of times.
- Record the results of each measurement.
- Calculate the standard deviation.
If you need to calculate repeatability for more than one data set, click the linked below to learn how to use the method of pooled variance.
Calculate repeatability for multiple sets of data
1.4 Example of Calculating Repeatability
In this example, I will follow the instructions above to show you how to calculate repeatability step-by-step. Plus, I will include images so you see how to calculate it.
1.4.1. Repeat a measurement ‘n’ number of times
Perform repeated back-to-back measurements keeping everything similar to the first measurement. You do not want to change anything with your setup or process.
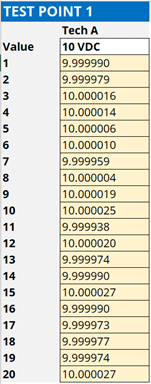
1.4.2. Record the results of each measurement
Record the results of your measurements. You can write them down on paper or enter them into a spreadsheet or calculator. Entering the results into a spreadsheet is preferred because you an analyze the data in Microsoft Excel and save your results.
1.4.3. Calculate the Standard Deviation
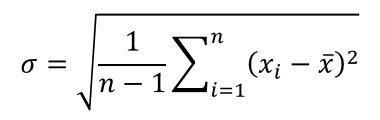
Analyze the results by calculating the standard deviation of your back-to-back measurements. You can use the standard deviation formula below or the STDEV function in Excel to make the calculation easy.
In the image below, you will see the formula for calculating standard deviation.
To calculate standard deviation in Microsoft Excel, use the function below and look at the image for reference.
=STDEV(cell1:celln)
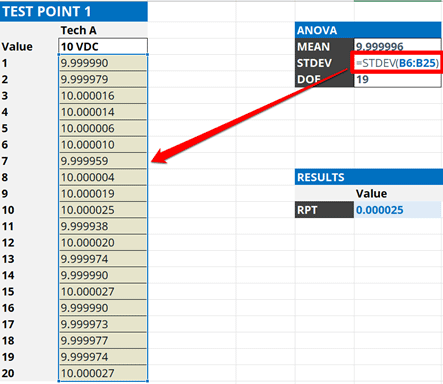
Note: If you want repeatability to represent the population of all your measurements, use the excel function STDEV.P().
The standard deviation will be your uncertainty associated with repeatability. Add it to your uncertainty budget and characterize it with a normal distribution where k=1.
2. Reproducibility
Reproducibility is a source of uncertainty in measurement you should include in every uncertainty budget. It shows you how much variability is in your measurements under reproducible conditions.
Most accreditation bodies require you to include reproducibility in your uncertainty analysis. Depending on your measurement process, your assessor may ask to see your Type A data and verify that it is included in your uncertainty budget.
What makes reproducibility different from repeatability is you need to change something (a variable) in your measurement process. Here is a list of the 5 most common types of reproducibility tests.
2.1 5 Types of Reproducibility Tests
Below is a list of the 5 most common types of reproducibility tests:
- Operator vs Operator Reproducibility
- Equipment vs Equipment Reproducibility
- Method vs Method Reproducibility
- Day vs Day Reproducibility
- Environment vs Environment Reproducibility
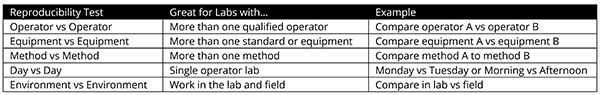
Which type of reproducibility test you perform is your decision. However, you can use the table below to find common recommendations.
2.2 Definition of Reproducibility
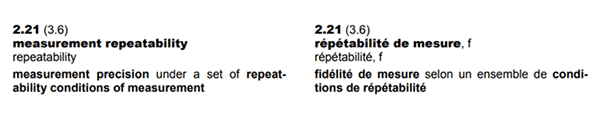
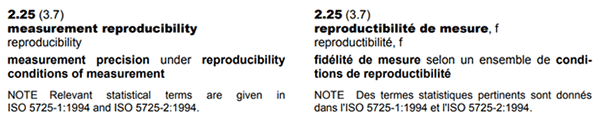
According to the Vocabulary in Metrology (VIM), reproducibility is defined as:
1: Measurement precision under reproducibility conditions of measurement (2.21)
In the image below, you will see the definition of reproducibility in the VIM.
2.3 How to Calculate Reproducibility
Calculating reproducibility is easy. Perform a repeatability test, change one variable, and conduct another repeatability test. Then, evaluate the variability in the results.
Follow the instructions below to calculate uncertainty due to reproducibility:
- Perform a Repeatability Test
- Calculate the mean or average of the results
- Change one variable:
- Operators,
- Equipment,
- Methods,
- Time, or
- Environments,
- Perform a new Repeatability Test
- Calculate the mean or average of the results
- Calculate the standard deviation of the test averages.
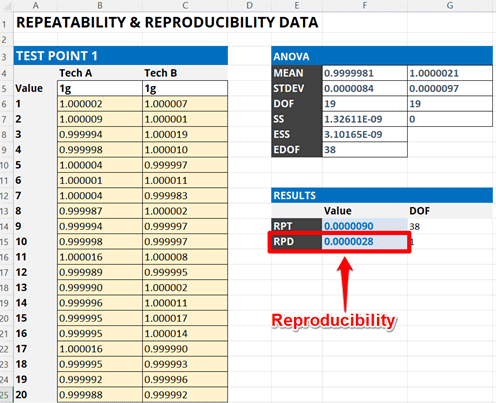
If you need more help, look at the images below for guidance.
2.4 Example of Calculating Reproducibility (Full Breakdown)
In this example, I will follow the instructions above to show you how to calculate reproducibility step-by-step. Plus, I will include images so you see how to calculate it.
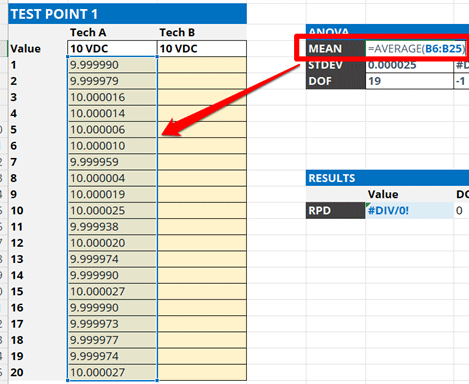
2.4.1 Perform a Repeatability Test
Conduct a repeatability test performing repeated back-to-back measurements and record your results. You will need them to evaluate reproducibility.
2.4.2 Calculate the Average of the Results
Calculate the mean or average of the results using the formula below or the AVERAGE function in Excel.
Below is the formula to calculate the mean or average of your results.
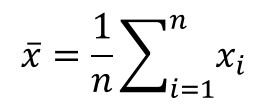
If you prefer to use a spreadsheet program, use the AVERAGE function.
=AVERAGE(cell1:celln)
2.4.3 Change One Variable
To conduct a reproducibility test, you need to change one variable and reproduce the results. The variable you change is up to you. However, there are some common recommendations based on your type of laboratory.
Commonly variables used for reproducibility testing include:
- Operators – Best for labs with multiple operators (most common)
- Equipment – Best for labs with more than one standard/equipment
- Methods – Best for labs use more than one method
- Time (e.g. Days) – Best for single operator labs
- Environments (e.g. Lab vs Field) – Best for labs that work in the lab and field
2.4.4 Perform Another Repeatability Test
Conduct another repeatability test with the new variable performing repeated back-to-back measurements and record your results.
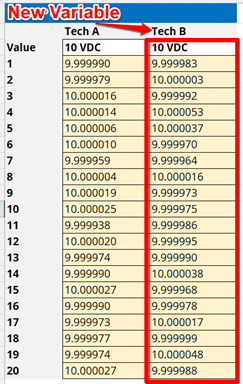
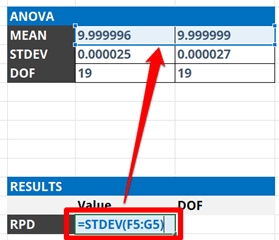
2.4.5 Calculate the Average of the Results
Calculate the mean or average of the results from the second repeatability test.
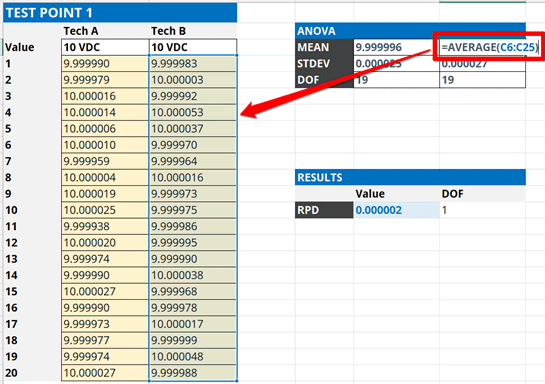
2.4.6 Calculate the Standard Deviation of the Results
Calculate the standard deviation of the two average values calculated in the previous steps. This will be the reproducibility of your test or measurement results.
Add the calculated reproducibility to your uncertainty budget and characterize it as a Type A uncertainty with a Normal distribution where k=1.
3. Stability
Stability is a source of uncertainty in measurement that should be included in most uncertainty budgets. It is an influence that you can:
- test yourself,
- calculate from your calibration results, or
- find in manufacturer’s specifications.
Stability is a random uncertainty used to evaluate the variability is in your measurements over time. It is commonly confused with Drift, which is a systematic uncertainty (we will cover this later).
To summarize, stability determines how stable your measurement process is over time.
If you are accredited with A2LA, their R205 requirements documents refer to this as “Reference Standard Stability.”
3.1 Definition of Stability
According to the Vocabulary in Metrology (VIM), stability is defined as:
1: Property of a measuring instrument, whereby its metrological properties remain constant in time (4.19)
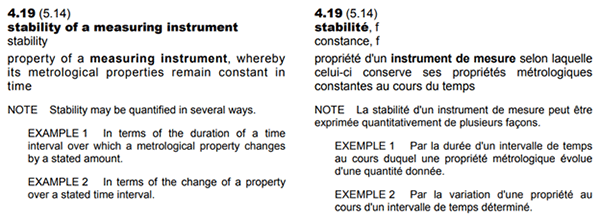
To simplify, it is an evaluation to determine how stable or consistent your measurements are over time.
3.2 How to Calculate Stability
3.2.1 Method A: Manufacturer’s Specification
In this section, you will learn how to use manufacturer’s accuracy specifications for stability.
Use this option if you:
- Only have one calibration report (i.e. typically new equipment).
- Do not want to calculate stability from previous calibration results.
- Do not mind overstating your CMC uncertainty.
- Do not mind the CMC uncertainty being larger than the equipment accuracy.
- Prefer less risk in your measurement results.
Follow the instructions below to find stability:
- Review the equipment’s user manual and datasheets.
- Find the Accuracy or Stability specifications for the function being evaluated.
- If required, calculate the stability from manufacturer’s specifications.
- Add the value to your uncertainty budget for:
- Stability or
- Reference standard stability.
3.2.2 Method B: Calibration Tolerance
In this section, you will learn how to use calibration tolerances for stability.
Use this option if you:
- Only have one calibration report (i.e. typically new equipment).
- Do not want to calculate stability from previous calibration results.
- Do not mind overstating your CMC uncertainty.
- Do not mind the CMC uncertainty being larger than the equipment accuracy.
- Prefer less risk in your measurement results.
Follow the instructions below to find stability:
- Review the equipment’s most recent calibration report.
- Find the calibration tolerance for the function being evaluated.
- If required, calculate the uncertainty from calibration tolerances.
- Find the upper and lower limit values.
- Subtract the upper limit value by the lower limit value.
- Divide the result by two (i.e. 2).
- Add the value to your uncertainty budget for:
- Stability or
- Reference standard stability.
3.2.3 Method C: Previous Calibration Data
In this section, you will learn how to calculate stability from your calibration results.
Use this option if you:
- Have 3 or more calibration reports (i.e. current and previous reports).
- Want smaller CMC uncertainty (i.e. typically smaller, but can be larger).
- Do not mind updating your uncertainty budgets after each calibration.
- Do not mind more risk in your measurement results.
Follow the instructions to calculate stability:
- Review your last 3 calibration reports.
- Record the results from each calibration report.
- Calculate the standard deviation of the calibration results.
3.3 Example of Calculating Stability
In this example, I will follow the instructions above to show you how to calculate stability step-by-step. Plus, I will include images, so you see how to calculate it.
3.3.1. Review your last 3 calibration reports.
Get the last 3 calibration reports for the equipment you are evaluating. Next, find the calibration results associated with the test point you are estimating uncertainty at.

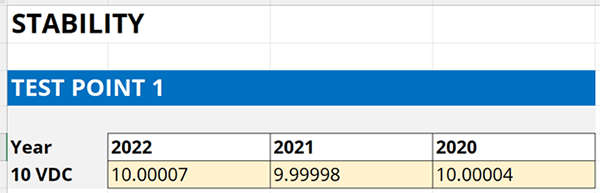
3.3.2. Record the results from each calibration report.
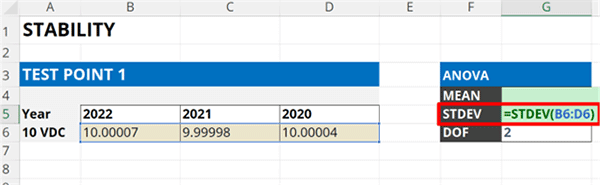
Record the results in an Excel spreadsheet. Look at the image below for reference.
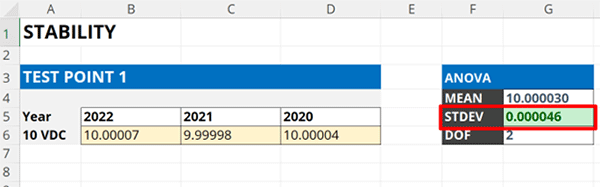
3.3.3. Calculate the standard deviation of the calibration results.
Calculate the standard deviation of the calibration results entered in the spreadsheet using the STDEV function.
In the image below, you will see how to use the STDEV function in Microsoft Excel to calculate standard deviation.
=STDEV(cell1:celln)
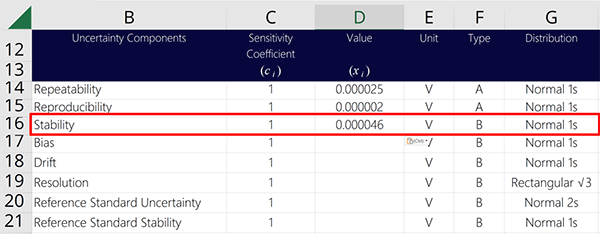
Finally, enter the results into your uncertainty budget and characterize it as a Type B uncertainty with a normal distribution where k=1.
3.4 Characterizing Stability
Based on consensus of many standard methods and measurement uncertainty guides, stability can be characterized using one of the following distributions:
- Normal Distribution,
- Rectangular Distribution, or
- Triangular Distribution.
3.4.1 Normal Distribution (Option A)
If you calculated stability as a standard deviation using your own data, characterize stability using with a Normal distribution where k=1.

3.4.2 Normal Distribution (Option B)
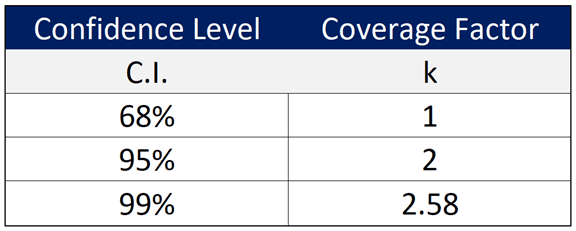
If you calculated stability from manufacturer’s specifications or calibration tolerances, and the manufacturer stated a particular confidence level (e.g. 68%, 95%, or 99%) or coverage factor (e.g. 1, 2, or 2.58), then characterize stability using with a Normal distribution where the divisor k is based on the stated confidence level or coverage factor.
3.4.3 Rectangular Distribution
If you calculated stability from manufacturer’s specifications or calibration tolerances, the manufacturer does not state a particular confidence level (e.g. 68%, 95%, or 99%) or coverage factor (e.g. 1, 2, or 2.58), and you do not know where the result will lie within the interval, then characterize stability using with a rectangular distribution with a square root of three divisor.

3.4.4 Triangular Distribution
If you calculated stability from manufacturer’s specifications or calibration tolerances, the manufacturer does not state a particular confidence level (e.g. 68%, 95%, or 99%) or coverage factor (e.g. 1, 2, or 2.58) and the target value is expected to lie in the center of the interval, then characterize stability using with a triangular distribution with a square root of six divisor.

3.5 Warning: Stability Confounds with Drift
It is important to remember stability may confound with drift. This means that stability and drift may contain some of the same data which can cause you to overstate your uncertainty by double counting uncertainty contributors.
If you can calculate both stability and drift using results from your calibration reports, the uncertainty components most likely confound each other because they evaluate the same data. Although the methods of evaluation are different, the results will contain elements of each other in their results. Therefore, you want to make sure to:
- Evaluate your results,
- Select the largest uncertainty contributor (i.e. Stability or Drift),
- Add it to your uncertainty budget, and
- Omit the other uncertainty contributor (i.e. Stability or Drift).
If you evaluate stability via testing or observation of a process over time, then it is less likely that stability and drift confound each other. You can most likely include both in your uncertainty budget, but you should still evaluate your results before doing so.
4. Drift
Drift is a source of uncertainty in measurement that should be included in the every uncertainty budget. It is an influence you can calculate from your calibration reports to see how much the error in your measurements changes over time.
Drift is a systematic uncertainty. It is commonly confused with Stability (for good reason), which is a random uncertainty. Essentially, drift determines how the error in your measurement process changes over time, and how much it can contribute to your estimate of uncertainty in measurement.
4.1 Definition of Drift
According to the Vocabulary in Metrology (VIM), drift is defined as:
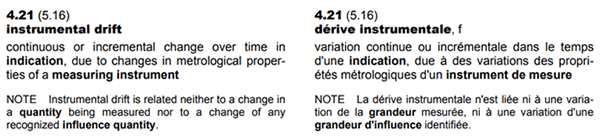
1: Continuous or incremental change over time in indication, due to changes in metrological properties of a measuring instrument (4.21)
In the image below, you can see the definition of drift from the VIM.
4.2 How to Calculate Drift
4.2.1 Method A: Drift Since Last Calibration
In this section, you will learn how to calculate drift since the last calibration using data from your calibration reports.
Do not include drift in your uncertainty budget if already included stability. You will most likely overstate your CMC uncertainty.
Below, you will see the formula to calculate drift from the last two calibration reports.

UD = Drift Uncertainty
y2 = most recent calibration result
y1 = previous calibration result
Follow these instructions to calculate drift:
- Review your last 2 calibration reports.
- Record the results from each calibration report.
- Calculate the difference between the two results.
- Add the value to your uncertainty budget for Drift.
4.2.2 Method B: Average Drift Between Calibrations
In this section, you will learn how to calculate average drift using data from your calibration reports.
Below, you will see the formula to calculate drift from the last two calibration reports.

UD = Drift Uncertainty
I = Calibration interval (in days)
δy = Difference or change in value
δt = number of days between calibration
Do not include drift in your uncertainty budget if already included stability. You will most likely overstate your CMC uncertainty.
In this section, you will learn how to calculate drift using data from your calibration reports.
Follow these instructions to calculate drift:
- Review your last 3 calibration reports.
- Record the results from each calibration report.
- Record the date each calibration was performed.
- Calculate the average daily drift rate.
- Multiply the average daily drift rate by your calibration interval (in days).
- Add the value to your uncertainty budget for Drift.
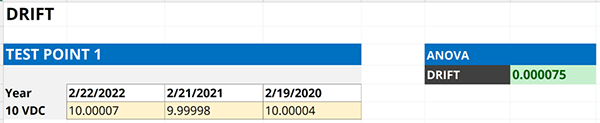
4.3 Example of Calculating Average Drift Since Last Calibration
In this example, I will follow the instructions above to show you how to calculate drift since last calibration step-by-step. Plus, I will include images to show you how to calculate it.
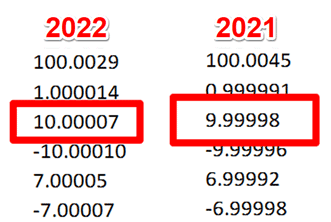
4.3.1. Review your last 2 calibration reports.
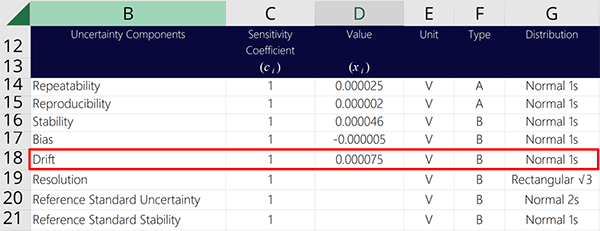
Start the evaluation of drift by reviewing your last 2 calibration reports. In the image below, you will see the calibration results from the last 2 calibrations for the test point being evaluated for uncertainty analysis.
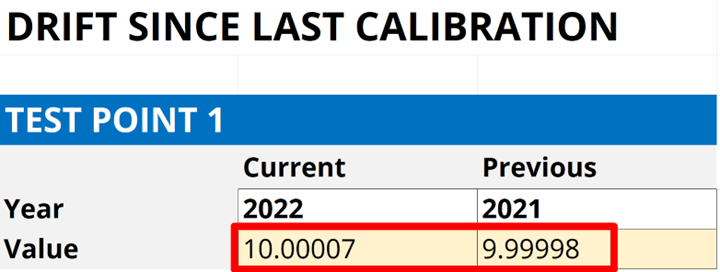
4.3.2. Record the results from each calibration report.
Record the results in a spreadsheet so you can evaluate them. Look at the image below for an example.
4.3.3. Calculate the Difference Between the Results.
Now, calculate the difference between the results (i.e. Subtract the current result by the previous result). Look at the image below for an example.
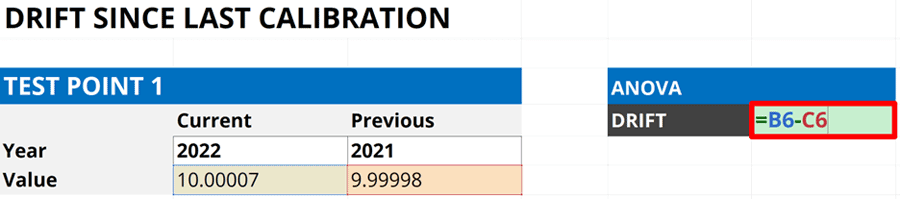
Finally, add the results into your uncertainty budget and characterize it as a Type B uncertainty with a rectangular with a square-root of three divisor.
4.4 Example of Calculating Average Drift
In this example, I will follow the instructions above to show you how to calculate drift step-by-step. Plus, I will include images, so you see how to calculate it.
4.4.1. Review your last 3 calibration reports.
Start the evaluation of drift by reviewing your last 3 calibration reports. In the image below, you will see the calibration results from the last 3 years for the test point being evaluated for uncertainty analysis.
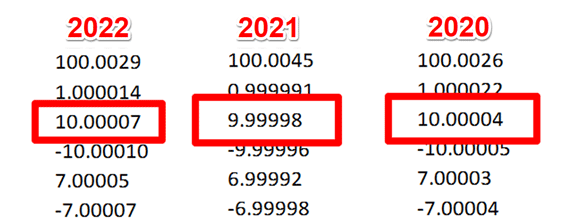
4.4.2. Record the results from each calibration report.
Record the results in a spreadsheet so you can evaluate them. Look at the image below for an example.
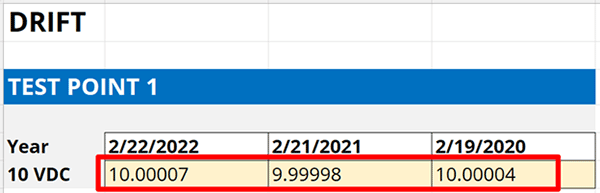
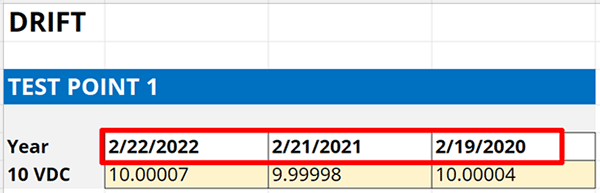
4.4.3. Record the date each calibration was performed.
Next, record the date each calibration was performed. You should find this in the same calibration reports you found the results in.
Make sure you associate the correct calibration date with its result. The dates are important for calculating a daily drift rate.
4.4.4. Calculate the average daily drift rate.
Now, calculate the average drift rate between each calibration. This process requires a few steps, so below you will find instructions and images to help you complete the process.
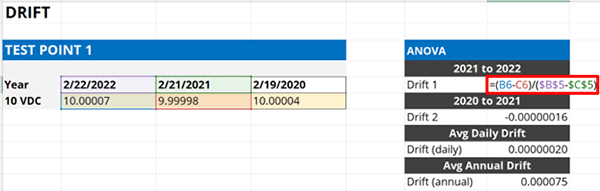
First, calculate the drift rate between the most recent and last calibrations.
- Subtract the most recent calibration result by the previous calibration result,
- Subtract the most recent calibration date by the previous calibration date,
- Divide the result in Step 1 by the result in Step 2.
Look at the image below. The formula is inside the red rectangle.
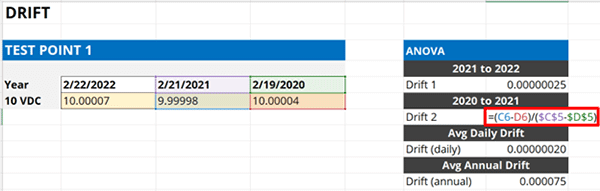
Next, calculate the drift rate between the last calibration and the previous calibration (i.e. 2 calibrations ago).
- Subtract the last calibration result by the previous calibration result,
- Subtract the last calibration date by the previous calibration date,
- Divide the result in Step 1 by the result in Step 2.
Look at the image below. The formula is inside the red rectangle.
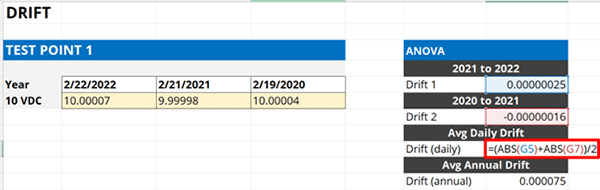
Now, you should have two drift rates. Calculate the average of the two drift rates. However, this can be tricky because the rates of drift can be positive or negative which can affect the average drift rate calculation. To fix this, you will need to calculate the absolute value of each drift rate.
- Calculate the absolute value of the first drift rate,
- Calculate the absolute value of the second drift rate,
- Calculate the average of the results in Step 1 and Step 2.
Look at the image below. The formula is inside the red rectangle.
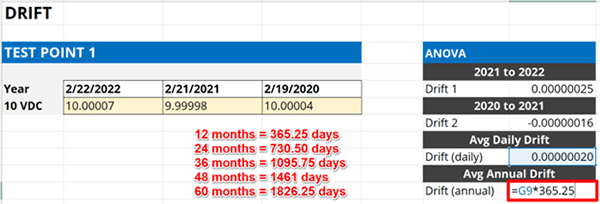
4.4.5. Multiply the average daily drift rate by your calibration interval (in days).
In the final step, multiply the average daily drift rate by the number of days in your calibration interval. A 12-month interval will have 365.25 days.
If your equipment has a 12-month calibration interval, then multiply your average daily drift rate by 365.25. The result will be the average drift rate over a 12-month period.
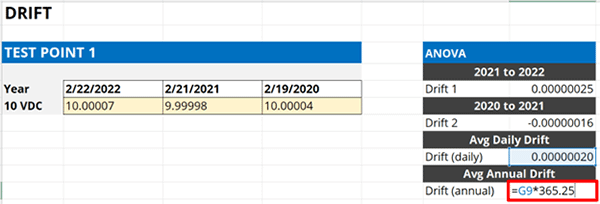
If you use a different calibration interval, then the number of days you will need to multiply your result by will be different. Look at the image below to see different multipliers based on calibration interval.
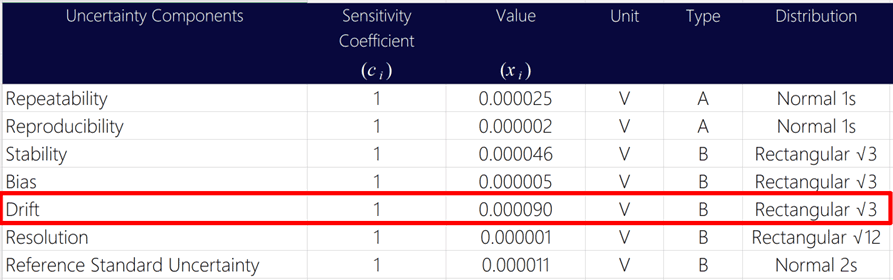
Finally, enter the results into your uncertainty budget and characterize it as a Type B uncertainty with a rectangular distribution with a square-root of three divisor.
4.5 Characterizing Drift
Based on consensus of many standard methods and measurement uncertainty guides, Drift is typically characterized using a Rectangular distribution with a square root of three.
Therefore, you will want to select a Rectangular distribution in your uncertainty budget and divide Drift by the square root of three.
Below, you will see the formula to convert Drift to a standard uncertainty with 68% confidence where k=1.

5. Bias
Bias is a source of uncertainty in measurement that can be optionally added to your uncertainty budget. You may know it as “Error.” It informs you of how accurate your measurements are compared to a target or nominal value.
Bias is a systematic error rather than an uncertainty. However, it can contribute to uncertainty if you do not take it into account when performing measurements. Therefore, this section will teach you how to handle bias in your uncertainty analysis.
5.2 Definition of Bias
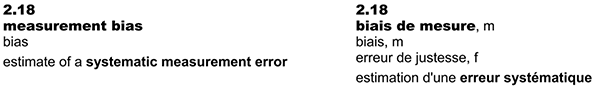
According to the Vocabulary in Metrology (VIM), bias is defined as:
1: Estimate of systematic measurement error (2.18)
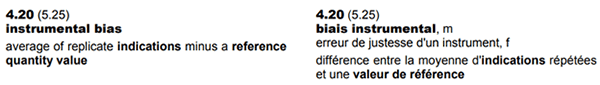
2: Average of replicate indication minus a reference quantity value (4.20)
In the image below, you can see the definition of measurement bias from the VIM.
In the next image, you will see the definition of instrument bias in the VIM.
5.3 When to include Bias in an Uncertainty Budget
To determine whether or not you should include bias in your uncertainty budget, read the following scenarios and see which best applies to your measurement process.
Scenario 1: I calibrate equipment using a measurement standard reporting the nominal value and the result only.
If you calibrate equipment comparing to the nominal or target value, then DO add bias to your uncertainty budget.
Scenario 2: I calibrate equipment using a known reference standard and report both the Standard value and the Unit Under Test value.
If you calibrated equipment using the certified value of your measurement standard and the result from the UUT, then DO NOT add bias to your uncertainty budget.
Scenario 3: I perform tests or measurements and make no corrections to my results.
If you do not correct your measurement results for bias, then DO include bias in your uncertainty budget.
Scenario 4: I perform tests or measurements and make corrections to my results using a known reference value or correction factor.
If you correct your measurement results for bias or error, then DO NOT include bias in your uncertainty budget.
Scenario 5: Stability or Drift, in my uncertainty analysis, is based on the manufacturer’s accuracy or calibration tolerance.
If you used the manufacturer’s accuracy specification or calibration tolerance for Stability, DO NOT include bias in your uncertainty analysis so long as your equipment or standard performs within specifications or tolerances. Otherwise, you will overstate your uncertainty.
If your equipment or standards do not perform with specifications or tolerances, DO include bias in your uncertainty budget.
5.3 How to Calculate Bias
In this section, you will learn how to calculate bias using your calibration results.
To keep it simple, calculate the difference between a result and a reference. The difference is the systematic error or bias that you want to add to your uncertainty,
Follow the instructions to calculate bias:
- Review your latest calibration report.
- Find the measured value or indication.
- Find the reference or standard value.
- Calculate the difference.
However, results and references come in many forms. So, I am going to give you a couple of scenarios to help relate the concept to you and your lab.
5.3.1 Comparison to a Measurement Standard
If comparing to a measurement standard (i.e. calibration), calculate bias by subtracting the measured result by the standard value.
bias = measured value – standard value
5.3.2 Comparison to a Reference Value
If comparing a result to a reference value, calculate bias by subtracting the indicated value by the reference value.
bias = indication – reference value
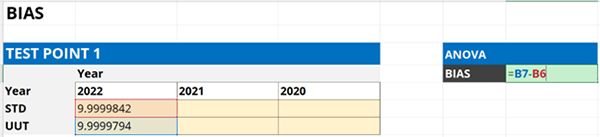
5.3.3 Calculating Bias in Microsoft Excel
You can calculate bias in Microsoft Excel using the formula below. Subtract one cell from the other. You will see examples of this calculation later in this section.
bias = cell2 – cell1
5.4 Example of Calculating Bias
In this example, I will follow the instructions above to show you how to calculate bias step-by-step. Plus, I will include images, so you see how to calculate it.
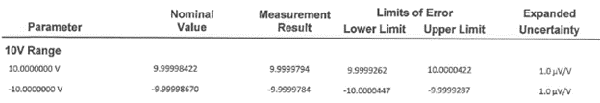
5.4.1. Review your latest calibration report.
Look at your most recent calibration report and find test point that you are evaluating.
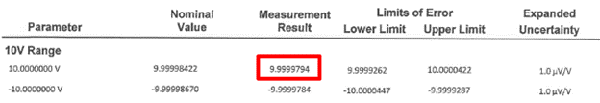
5.4.2. Find the As Left value or measurement result.
Now, find the ‘As Left’ measurement result in your calibration report. See the example in the below image.
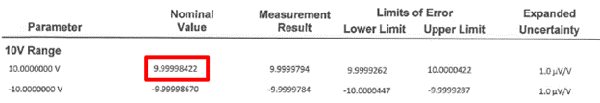
5.4.3. Find the Nominal value or standard value.
Next, find the ‘Nominal,’ ‘Standard,’ or ‘Reference’ value in your calibration report. See the example in the below image.
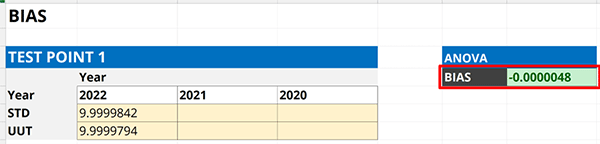
5.4.4. Calculate the difference.
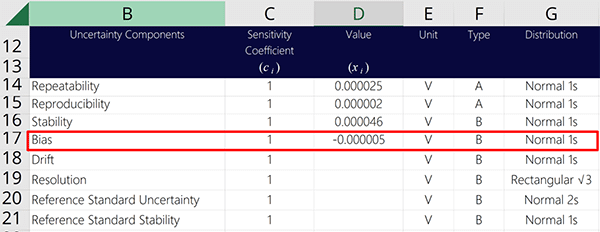
Subtract the ‘As Left’ result by the ‘Nominal’ or ‘Standard’ value to calculate bias.
Finally, enter the results into your uncertainty budget and characterize it as a Type B uncertainty with a normal distribution where k=1.
5.5 Characterizing Bias
Based on consensus of many standard methods and measurement uncertainty guides, Bias is typically characterized using a Rectangular distribution with a square root of three.
Therefore, you will want to select a Rectangular distribution in your uncertainty budget and divide Bias by the square root of three.
Below, you will see the formula to convert Bias to a standard uncertainty with 68% confidence where k=1.

In other situations, Bias may be evaluated as a standard uncertainty with 68% confidence where k=1. This would not require further conversion to a standard uncertainty. Therefore, characterize it with a normal distribution in your uncertainty budget with a divisor of one.

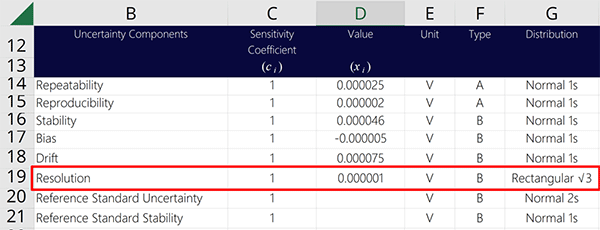
6. Resolution
Resolution is a source of uncertainty in measurement that must be included in every uncertainty budget. The goal is to consider the limitations resolution has on your measurement capabilities.
When including resolution in your uncertainty analysis, you may need to consider one or more of the following:
- Resolution of test or measurement equipment,
- Resolution of the sample, item, product, or Unit Under Test (UUT), and(or)
- Resolution of the reported result.
Additionally, resolution can vary based on the type of device, equipment, or result being evaluated. Furthermore, resolution can be evaluated several ways (i.e. full-resolution or half-resolution).
In this section, you will learn all about resolution and how to evaluate it.
6.1 Definition of Resolution
According to the Vocabulary in Metrology (VIM), resolution is defined as:
1: Smallest change in a quantity being measured that causes a perceptible change in the corresponding indication (4.14)
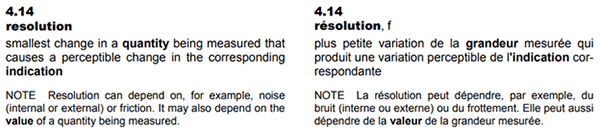
In the image below, you can see the definition of resolution from the VIM.
6.2 How to Find Resolution
Finding resolution is simple, but where to look depends on your measurement system. So, let’s consider different types of systems, including:
- Digital Devices
- Analog Devices
- Reference Standards/Artifacts
- Reference Materials
- Test Results
6.2.1 Resolution of Digital Devices
Follow the instructions below to find the resolution of digital devices:
- Look at the digital display of the measurement system or equipment,
- Find the least significant digit, and
- Observe the smallest incremental change; or
- Look at the specifications in equipment manuals and datasheets.
6.2.2 Resolution of Analog Devices
Follow the instructions below to find the resolution of analog devices:
- Look at the analog scale of the measurement system or equipment,
- Find at the markers (i.e. lines) on the analog scale , and
- Determine the interval between the scale markers; or
- Look at the specifications in equipment manuals and datasheets.
6.2.3 Resolution of Reference Standards & Artifacts
Follow the instructions below to find the resolution of artifacts (e.g. gauge blocks, standard masses, etc.):
- Look at the artifact’s most recent calibration report,
- Find the certified value of the artifact,
- Find the least significant digit, and
- Determine the resolution of the certified value.
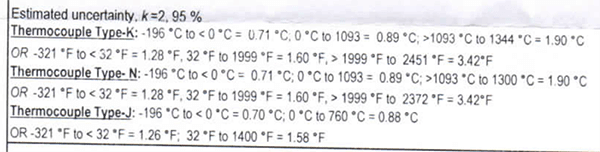
6.2.4 Resolution of Reference Materials
Follow the instructions below to find the resolution of reference materials:
- Look at the reference material certificate of analysis or label,
- Find the certified value of the reference material,
- Find the least significant digit, and
- Determine the resolution of the certified value.
6.2.5 Resolution of Test Results
Follow the instructions below to find the resolution of Test Results:
- Look at a test report or the test method,
- Find the test result (in the report) or the reporting requirements (in the method),
- Find the least significant digit of the test result or reporting resolution in the method, and
- Determine the resolution.
6.3 Resolution Uncertainty Examples
In this section, you will see some examples of resolution from different types of standards and devices.
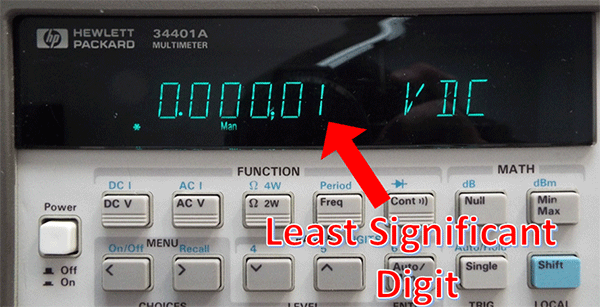
6.3.1 Resolution of Digital Devices
In the image below, you will see the resolution of a digital device (i.e. digital multimeter). Remember to look at the least significant digit and determine the smallest incremental change. These typically occur at intervals of 0.5, 1, 2, or 5.
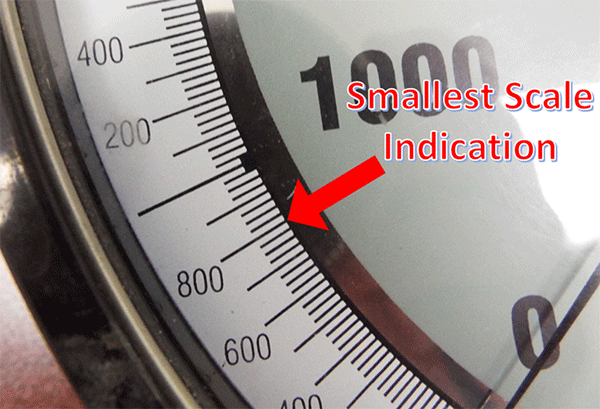
6.3.2 Resolution of Analog Devices
In the image below, you will see the resolution of an analog scale (i.e. pressure gauge). Remember to observe the spacing between the markers, the width of the markers, and the width of the needle or pointer. From these factors, you can determine the resolution uncertainty of your measuring equipment or the unit under test.
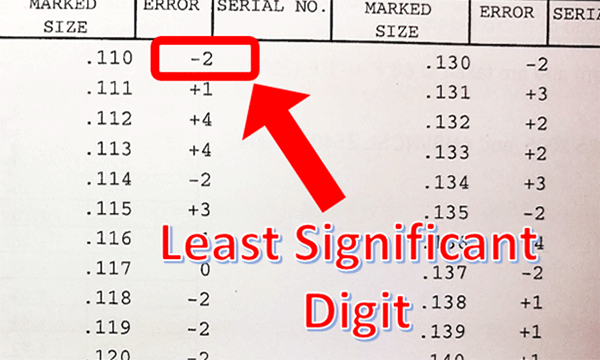
6.3.3 Resolution of Reference Standards & Artifacts
In the image below, you see that you must review your calibration reports to determine the resolution of an artifact. Look at the artifact’s certified value or reported error and find least significant digit of the reported value. This will be the resolution.
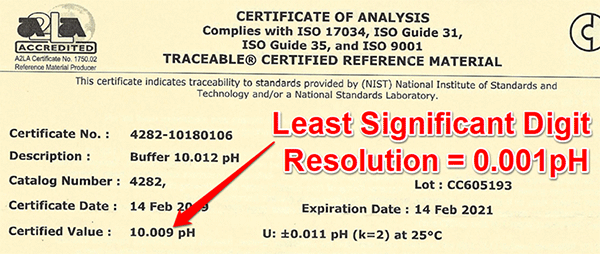
6.3.4 Resolution of Reference Materials
In the image below, see that you must review your certificate of analysis to determine the resolution of a reference material. Look at the reference material’s certified value and find least significant digit of the reported value. This will be the resolution.
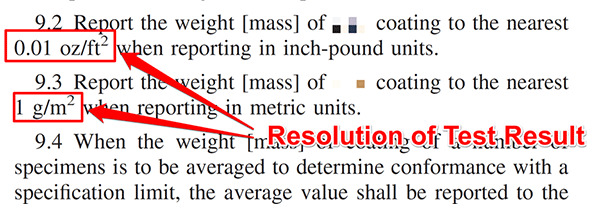
6.3.5 Resolution of Test Results
In the image below, look at the excerpt from a test method. Notice the method specifies the resolution of the reported result. Use this as your resolution.
After you determine your resolution, add it to your uncertainty budget. Look at the image below to see how. Characterize resolution as a Type B uncertainty with a rectangular distribution.
When selecting the rectangular distribution, you have the option of evaluating the full resolution using the square-root of 3 divisor or half resolution using the square-root of 12 divisor. The options is up to you. Both options are typically acceptable.
6.4 Characterizing Resolution
Resolution is typically characterized using a Rectangular distribution with a square root of three. However, resolution can be evaluated as:
- Full Resolution or
- Half Resolution
6.4.1 Full Resolution
When resolution is evaluated as full resolution or its actual value, it is characterized with a rectangular distribution with a square root of three divisor.
Below, you will see the formula to convert resolution to a standard uncertainty with 68% confidence where k=1.

6.4.1 Half Resolution
When resolution is evaluated as half resolution or half of its actual value, it is characterized with a rectangular distribution with a square root of 12 divisor.
Below, you will see the formula to convert half resolution to a standard uncertainty with 68% confidence where k=1.

6.5 Full Resolution vs Half Resolution
Resolution can be evaluated as full resolution (R) or half resolution (0.5R). In many cases, it is recommended to evaluate half the resolution for your resolution uncertainty.
The choice is up to you.
In most cases it is appropriate and recommended to add half the resolution to your uncertainty budget. In some cases, it is my opinion that it is not. However, it is a debatable topic. So, consider evaluating your resolution uncertainty as half resolution or 0.5R and see how it affects your uncertainty analysis.
As easy as it sounds, convert your resolution to half resolution by multiplying it by 0.5 or you can divide it by two.
Another option is to use the rectangular distribution where the divisor is the square-root of 12 or √12. The result is the same as 0.5R divided by the square-root of 3.
If resolution is a significant or dominant factor in your uncertainty analysis, there is a benefit to using half-resolution. If resolution is insignificant or negligible, then you will not see any benefit to using half-resolution.
6.6 To Include or Not Include Resolution of the UUT or DUT.
When performing uncertainty analysis, sometimes it is recommended to include the resolution of the device, item, sample, product, or unit under test.
Typically, if you are a test laboratory, you do not need to include UUT Resolution. However, you should verify this with your test method, standard industry practices, and accreditation body requirements.
If you are a calibration laboratory, you are required to include UUT Resolution in your uncertainty analysis. Whether you prefer to include UUT resolution in your uncertainty budget (that supports your scope of accreditation) or at the time of calibration is up to you. Ultimately, it must be included in the expanded uncertainty reported in your calibration reports.
Make sure to refer to the ILAC P14 for more information.
6.7 Pros and Cons: Including UUT Resolution in Your Uncertainty Budgets
Including UUT Resolution in your CMC uncertainty budgets has pros and cons. Pros are that it can prevent you from doing further uncertainty analyses. Cons are it cause you to overstate uncertainty (in some situations) and(or) require you to remove and replace the UUT resolution for different UUT’s.
To determine whether or not you should include UUT resolution in your uncertainty budget depends on your lab and it’s processes. Below, you can read several scenarios and see which outcome best applies to your measurement process.
Scenario 1: If your lab estimates measurement uncertainty for one single measurement process where the resolution of the UUT never changes, then add UUT Resolution to your uncertainty budget.
In Scenario 1, you would benefit from adding the UUT resolution to your uncertainty budget because the UUT resolution never changes, such as calibrating a gauge block, standard weight, or other type of device.
Adding UUT resolution to your uncertainty budget prevents you from calculating measurement uncertainty after every test or calibration.
Scenario 2: If your lab estimates measurement uncertainty for a measurement function or parameter where the UUT resolution can vary, then DO NOT add UUT resolution to your uncertainty budget.
In Scenario 2, you would not add UUT resolution to your uncertainty budget because it is subject to change at any time. Therefore, you would benefit from adding UUT resolution to your calibration uncertainty at the time of calibration.
Again, make sure to read the ILAC P14 policy for calculating calibration uncertainty.
7. Reference Standard Uncertainty
Reference standard uncertainty is a source of uncertainty in measurement that should be included in every uncertainty budget. It is an influence that you can find by looking at your calibration reports or certificates of analysis.
Reference standard uncertainty is a systematic uncertainty. It is introduced from the calibration of your equipment or certified reference material. Additionally, its value is traceable to a national or international standard which is why it is so important. Hence, the reason many people refer to it as calibration uncertainty or traceable uncertainty.
“I see more laboratories get deficiencies for leaving reference standard uncertainty out of their uncertainty budget.”
Many labs get a deficiency during an assessment for:
- leaving reference standard uncertainty out of their uncertainty budget,
- forgetting to update it to match a calibration report or certificate of analysis, or
- not having their equipment calibrated by a competent supplier.
Do not make the same mistake. Get your equipment calibrated by an ISO/IEC 17025 accredited laboratory or purchase your reference materials from an accredited producer and include the reference standard uncertainty in your uncertainty budget.
7.1 Definition of Reference Standard Uncertainty
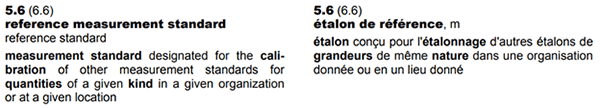
Using a modified definition from the Vocabulary in Metrology (VIM), reference standard uncertainty is defined as:
1: Uncertainty of a measurement standard designated for the calibration of other measurement standards for quantities of a given kind in a given organization or at a given location
It is a modified definition based on reference measurement standard. In the image below, you can see the definition of reference measurement standard (5.6) from the VIM.
Reference standard uncertainty is commonly called or referred to as:
- Calibration Uncertainty, and(or)
- Traceable Uncertainty
7.2 How to Find Reference Standard Uncertainty
Reference standard uncertainty can be found in your calibration reports and certificates of analysis. Follow the instructions below to find reference standard uncertainty:
- Review your latest calibration report or certificate of analysis.
- Find the reported estimate of measurement uncertainty
7.3 Example of Finding Reference Standard Uncertainty
In this example, I will follow the instructions above to show you how to find the reference standard uncertainty step-by-step. Plus, I will include images, so you see how to calculate it.
7.3.1 Review your latest calibration report or certificate of analysis.
Review the most recent calibration report or certificate of analysis. Find the reported value you are estimating uncertainty at.
7.3.2 Find the reported estimate of measurement uncertainty
Now that you have the calibration report or certificate of analysis, look for the reported expanded uncertainty associates with the value you are estimating uncertainty. This is your reference standard uncertainty.
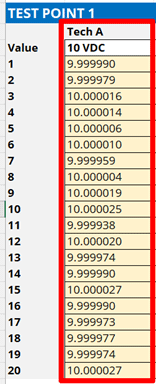
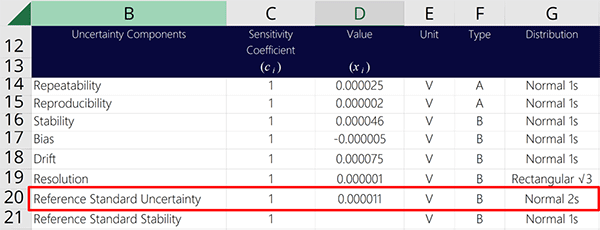
In the image below, you will see the expanded uncertainty associated with the 10 VDC value I am evaluating uncertainty in my uncertainty budget.
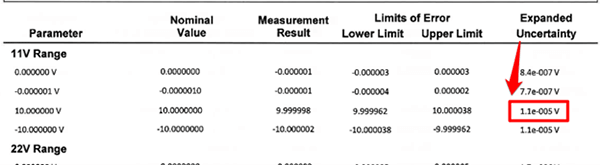
Finally, enter the reference standard uncertainty into your uncertainty budget and characterize it as a Type B uncertainty with a normal distribution where k=2.
Expanded uncertainties in accredited certificates are reported to 95% confidence. This is why you will use a normal distribution where k=2
7.4 More Examples of Reference Standard Uncertainty in Certificates
Reference standard uncertainty is not always reported next to every result. Instead, accredited laboratories may report their uncertainties in other sections of the certificate. Make sure to review the entire certificate to find them. You may find the reference standard uncertainty in the:
- Notes or comments section,
- Disclaimer statements,
- Its own section, or
- Addendum to the report.
In the image below, you will see the reference standard uncertainty is reported in its own section of the report where all of the associated uncertainty are reported together.
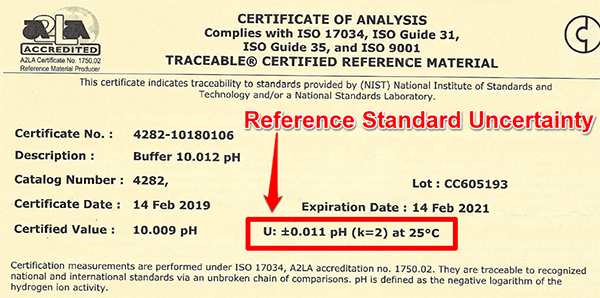
In the next image, you will see the reference standard uncertainty for a pH buffer solution reported at the top a certificate of analysis.
If you cannot find reference standard uncertainty in your report, and it is an accredited report, you may have received a simplified certificate. Contact the laboratory and request a full report. You will need it for your uncertainty analysis.
7.5 Most Recent Uncertainty vs Averaging Uncertainties
When evaluating reference standard uncertainty, there are two common methods:
- Reporting the most recent reference standard uncertainty, or
- Averaging the reference standard uncertainties
Most people will include the most recent reference standard uncertainty from their calibration reports or certificates of analysis. This is what I typically recommend and how I evaluate the reference standard uncertainty.
However, there are some people who average the last three values of their reference standard uncertainty and put the calculated average in their uncertainty budget.
Either approach is acceptable. So, use the method that works best for you.
If you are seeking to lower your estimates of measurement uncertainty, use the method that gets you the smallest result.
8. Other Uncertainty Sources
Although it is recommended to include these 7 sources of uncertainty in every uncertainty budget, there are many other contributors to uncertainty that you should include in your uncertainty analysis.
There is no way to list them all in this guide because every test or measurement function will have its own unique set of uncertainty contributors. Therefore, you will need to conduct research to find sources of uncertainty associated with your test or measurement function.
8.1 Where to Find Sources of Uncertainty
Some great places to find sources of measurement uncertainty are;
- Online Search,
- Uncertainty Guides,
- Calibration Reports,
- Certificates of Analysis,
- Test/Calibration Methods,
- Equipment Manuals,
- Equipment Datasheets,
- Technical Guides,
- Application Notes,
- White Papers,
- Journal Articles,
- Conference Papers,
- Textbooks,
- Other Laboratory’s Uncertainty Budgets, and
- Experts in your field of testing of calibration
8.2 Sources of Uncertainty in Your Measurement Process
Next, evaluate your measurement process and equations to identify additional sources of measurement uncertainty related to your test or calibration. Many standard methods list the sources of uncertainty related to the test or calibration. If you have an equation, each variable in the equation is a potential source of uncertainty. So, methods and formulas can be very helpful.
Also, consider common sources of uncertainty to see if any of them relate to your specific test or calibration process.
Some key categories for sources of uncertainty are:
- Equipment
- Method
- Operator
- Item/Unit Under Test
- Calibration
- Environment
8.3 Environmental Sources of Uncertainty
Finally, environmental sources of uncertainty can be very broad. Consider the following sources of uncertainty to see if any of them relate to your specific test or calibration process.
Some common environmental sources of uncertainty are:
- Temperature,
- Relative Humidity,
- Barometric Pressure,
- Local Gravity,
- Elevation,
- Air Density,
- Air Buoyancy,
- Vibration,
- Noise,
- Illuminance,
- Magnetism,
- EMI/EMF, and
- Dirt/Dust
So, make sure to consider other sources of uncertainty in your analysis if they are relevant to your test or measurement process.
If you are still stuck after searching all of these information sources, then contact me! I will be glad to help you or even create an uncertainty budget for you.
Conclusion
In this article, you should have learned the 7 sources of uncertainty in measurement that should be included in every uncertainty budget. Additionally, this guide taught you how to calculate each one of them (with detailed instructions) using data that you already have.
Hopefully, you found this guide valuable and will use it as a resource to help you estimate uncertainty. If there is anything that you think I should add, just let me know.
Now, I want you to download my guide, try these calculations yourself, and include these contributors to measurement uncertainty in your next uncertainty budget.
If you want a calculator that will automatically calculate all of these sources of uncertainty, check out my Easy Uncertainty Calculator for Excel. It is a great tool to easily create uncertainty budgets.
Learn more about the Easy Uncertainty Calculator for Excel

18 Comments